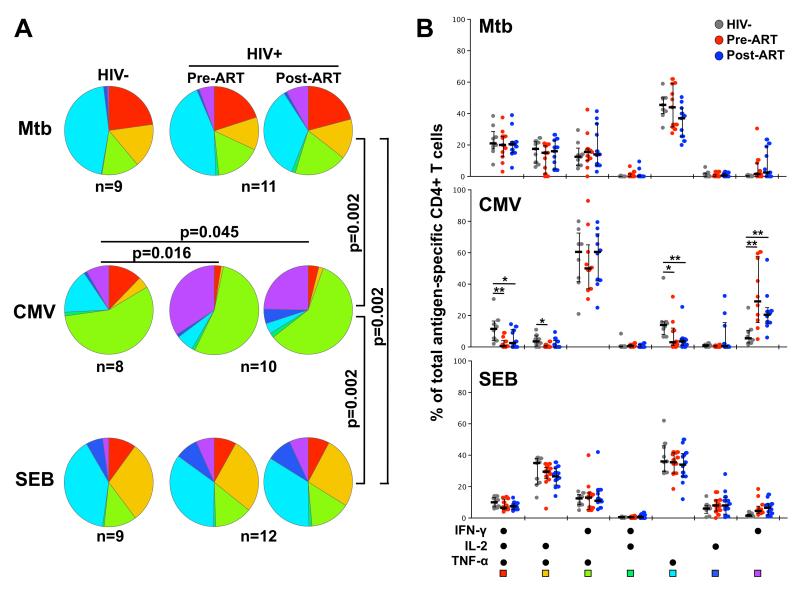
FIGURE 3. Polyfunctional capacity of Mtb-, CMV- and SEB-specific CD4+ T cells in HIV-infected and uninfected individuals pre- and post-ART.
Pie charts (A) and graphs (B) representing the cytokine secretion ability of Mtb-, CMV- and SEB-specific CD4+ T cell responses in HIV-uninfected individuals (n=9) and HIV-infected individuals pre-and post-ART initiation. Each section of the pie chart represents a specific combination of cytokines, as indicated by the color at the bottom of the graph. Horizontal bars depict the median with interquartile range indicated. Statistical comparisons were performed using a Wilcoxon rank-sum test. *p < 0.05, **p < 0.01, ***p < 0.001.

