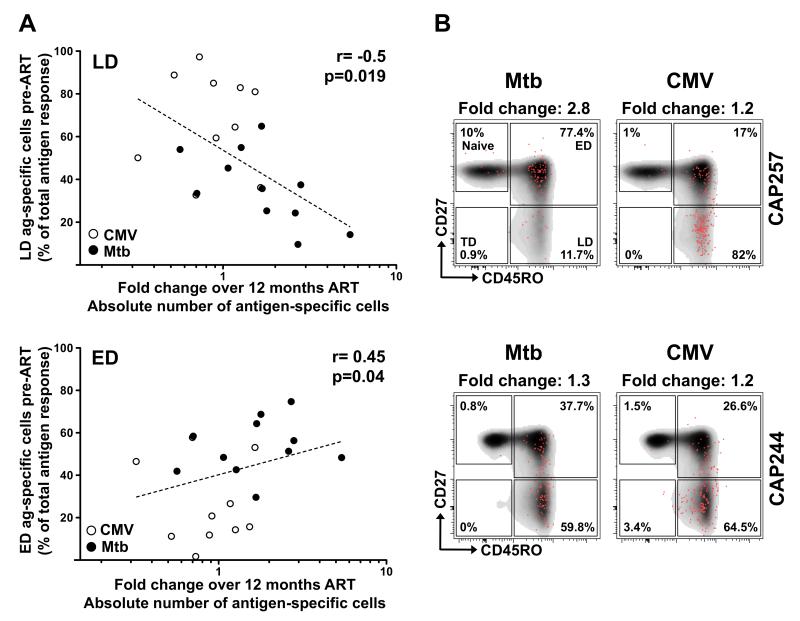
FIGURE 5. Relationship between the memory profile of Mtb- and CMV-specific CD4+ T cells and the dynamics of restoration of these cells.
(A) Association between the proportion of antigen-specific CD4+ T cells exhibiting a late differentiated (LD; top panel) or early differentiated (ED; bottom panel) profile with the fold change in antigen-specific CD4+ T cell absolute count after ART. Statistical associations were performed by a two-tailed non-parametric Spearman rank correlation. (B) Representative examples of the memory profile of Mtb- or CMV-specific CD4+ T cells pre-ART in two individuals. The frequencies of each subset are indicated. For each example, the fold change in antigen-specific absolute CD4+ T cell count pre-and post-ART is indicated at the top of each plot.

