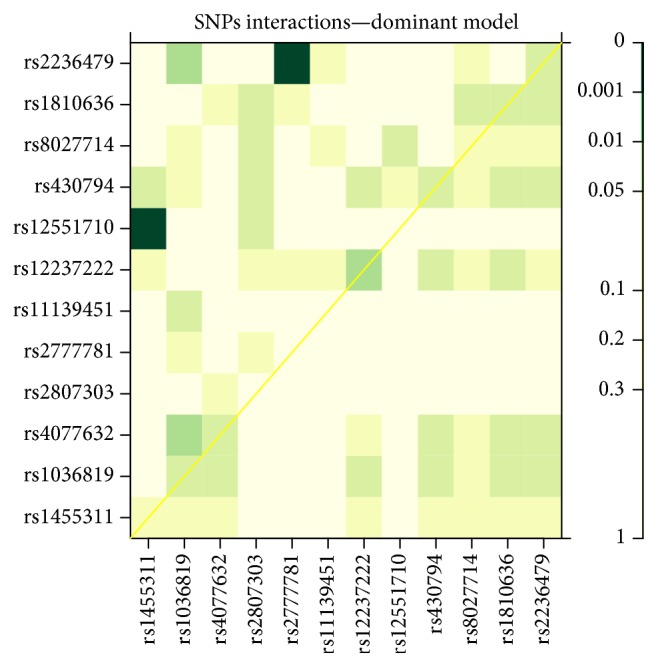
Figure 1.

Gene-gene interaction plot. The plot shows the significance levels of gene-gene interactions and pelvic organ prolapse (POP) in the dominant model. Each plot indicated the P values preceded by different likelihood ratio tests. Different colors show different levels of statistical significance. The diagonal line contains the P values from likelihood ratio test for the crude effect of each SNP. The upper triangle in the matrix presents the P values for the interaction (epistasis) log-likelihood ratio test. The lower triangle shows the P values from likelihood ratio test comparing the two-SNP additive likelihood to the best of the single-SNP models.
