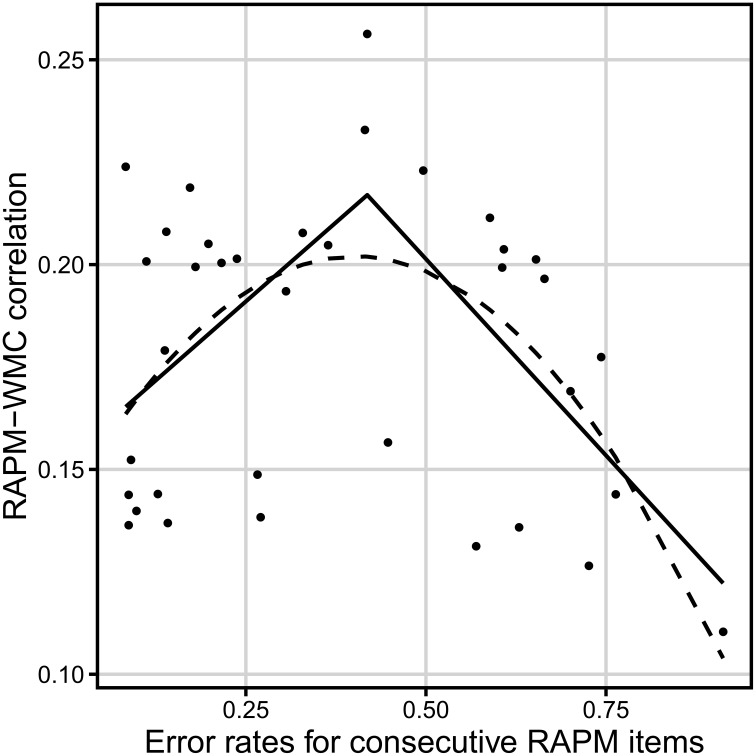
Figure 7.
Relation between the dificulty of a Raven-test item (error rate) and the correlation between accuracy on that item and WMC (measured by the short-term memory and relational integration task). The solid line represents the segmented regression line. The dashed line reflects the quadratic regression line N = 939.

