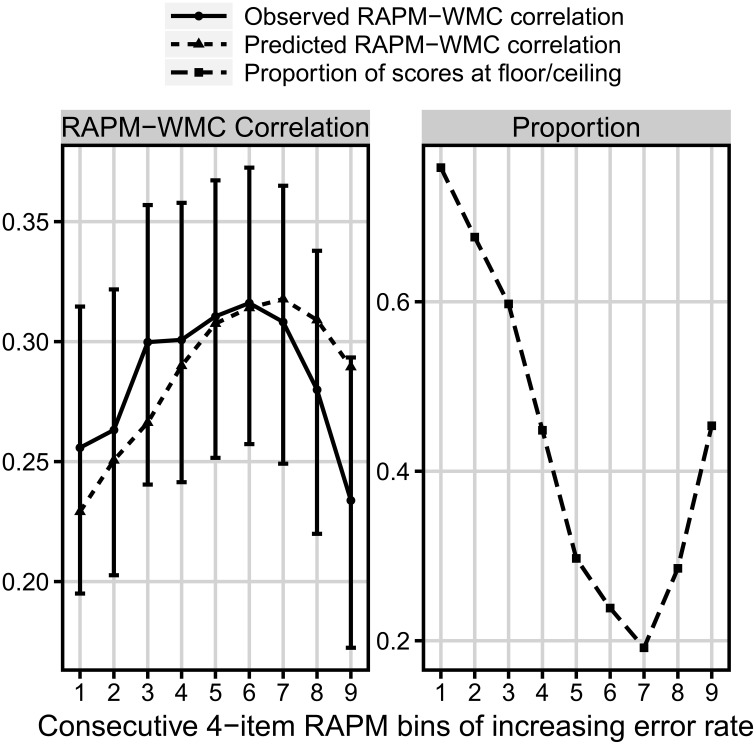
Figure 8.
Comparison of three measures as a function of the consecutive bins increasing in difficulty. Left: the observed (solid line) and predicted (dotted line) bin correlation with WMC (measured by the short-term memory and relational integration task). Right: the proportion of floor/ceiling effect (dashed line) N = 939.

