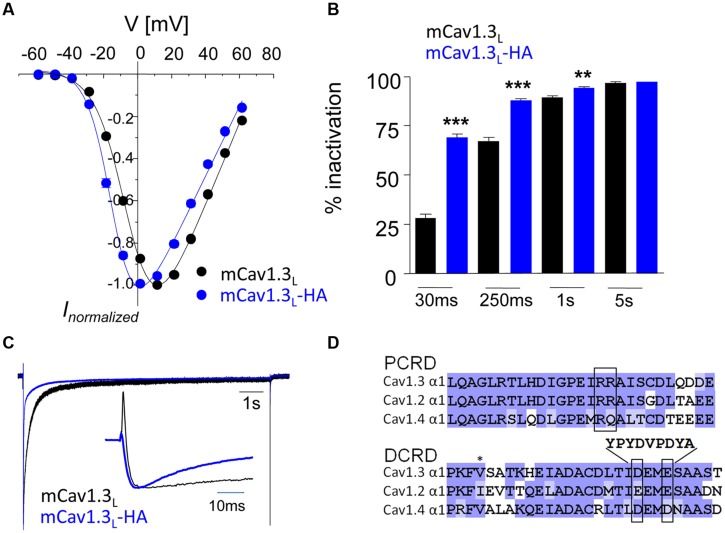
FIGURE 1.
Activation and inactivation properties of ICa through mCav1.3L and mCav1.3L-HA channels. (A) α1-subunits were heterologously expressed in tsA-201 cells together with β3 and α2δ1 (at least three independent transfections). Whole-cell patch-clamp current–voltage relationship obtained by depolarizations from a Vh of -80 mV to the indicated test potentials in cells transfected with mouse wild-type (WT) Cav1.3 (mCav1.3L, black) and mCav1.3L-HA (blue). All data were junction potential – corrected. (B) Percent ICa inactivation (15 mM Ca2+) during a test pulse from -80 mV to the Vmax. ∗∗∗p < 0.001; ∗∗p < 0.01 (one-way ANOVA analysis followed by Bonferroni post-test). Data are means ± SE (error bars often smaller than symbols). For gating parameters, n-numbers and statistics see Table 1. (C) Normalized ICa recordings in tsA-201 cells expressing mCav1.3L or mCav1.3L-HA channel complexes. Cells were depolarized for 10 s from -90 mV to Vmax. The inset shows the first 50 ms of the test pulse. Notice the transient at the beginning of the pulse reflecting ON gating currents which were prominent in mCav1.3L but absent or barely visible in Cav1.3DCRDHA (indicating higher open probability of short Cav1.3 α1-isoforms in agreement with our previous findings; Bock et al., 2011; Lieb et al., 2014). Cells 1005090023, 1804090028. (D) To disrupt CTM function residues DEME (amino acids 2073-2076; NCBI accession number EU363339) were replaced by a single 9-residue HA-tag. Successful functional disruption was verified in electrophysiological experiments (A–C). This can be explained by removal of one of the negative charges required for interaction with the PCRD by the HA-tag and as well as disruption of the putative α-helical structure in this region (as predicted using secondary structure prediction by Jpred; Cole et al., 2008).

