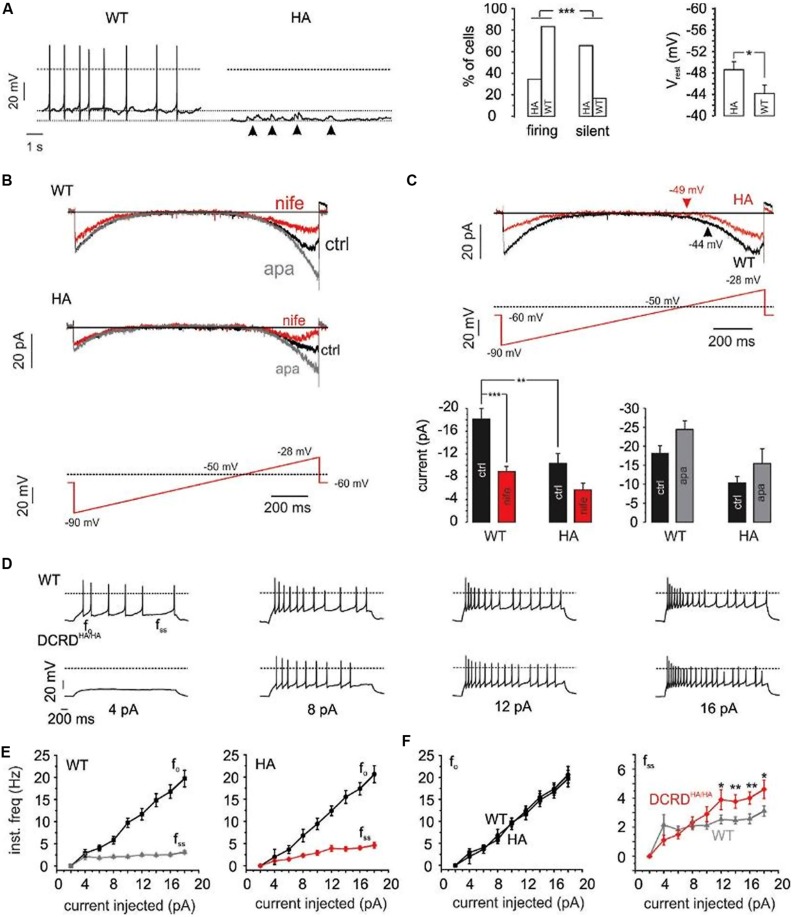
FIGURE 10.
Firing properties of WT – vs. DCRDHA/HA MCCs. (A) Left: current-clamp traces of representative WT (black) and Cav1.3DCRDHA/HA (red) MCCs without current injection. Dashed lines indicate baseline, dotted line indicates 0 mV. Right: percent of firing vs. silent cells and comparison of Vrest for WT (n = 18) and Cav1.3DCRDHA/HA (HA, n = 32) MCCs. Significance testing on categorical data was performed by RxC contingency tables and a chi–square test (∗∗∗p < 0.001) while a Student’s t-test was used for Vrest (∗p < 0.05). (B) Averaged Na+, K+, and Ca2+-currents of WT (n = 9) and Cav1.3DCRDHA/HA (n = 7) MCCs to the illustrated slow ramp protocol in the absence (black, ctrl) or presence of nifedipine (3 μM, red) and during SK channel block by apamin (200 nM, gray). (C) Top: overlay of WT (black) and Cav1.3DCRDHA/HA averaged currents (red) elicited by the indicated ramp protocol. Arrows indicate the mean Vrest of both cell populations. Bottom: statistics for peak inward currents at about -25 mV triggered by the ramp protocol of control traces (black), during nifedipine (red) or SK channel block by apamin (gray) for WT (n = 9) and Cav1.3DCRDHA/HA (n = 7) MCCs (∗∗p < 0.01, ∗∗∗p < 0.001, one–way ANOVA followed by a Bonferroni post hoc analysis). (D) Representative current-clamp traces at increasing current injections from Vh = -70 mV from WT (black) and Cav1.3DCRDHA/HA (red) MCCs. (E) Graphical representation of fo and fss for WT (n = 15) and Cav1.3DCRDHA/HA (n = 16) MCCs with increasing current injections. fo, is the first inter-spike interval frequency and fss, is the last inter-spike interval frequency. (F) Overlay of fo and fss from (E) to highlight differences (∗p < 0.05, ∗∗p < 0.01, paired Student’s t-test).

