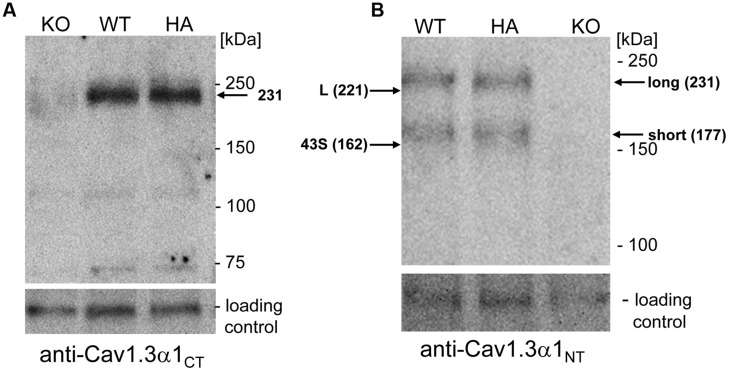
FIGURE 3.
Western blot analysis of α1-subunits in WT and mutant mouse brain homogenates. (A) Proteins (100 μg/lane) were separated on 5% SDS page and immunostained with polyclonal antibody Cav1.3 α1CT. The Cav1.3 α1 subunit was specifically detected as a 231 kDa protein at expression levels indistinguishable between WT and homozygous mutants (HA) (see Results). KO, Cav1.3-/- negative control. (B) Same separation as in A (100 μg/lane) but detection with anti-Cav1.3α1NT. The migration of recombinant mCav1.3L (L) and mCav1.343S (43S) on the same gel (not shown) and their calculated molecular mass are indicated by arrows (left). Migration of molecular mass standards as well as the brain long and short α1-subunit species are also indicated (right). An unspecific ∼120 kDa band served as loading control. One representative experiment of at least three independent experiments is shown for all panels. KO, Cav1.3-/-; HA, Cav1.3DCRDHA/HA, WT, wild-type littermate.

