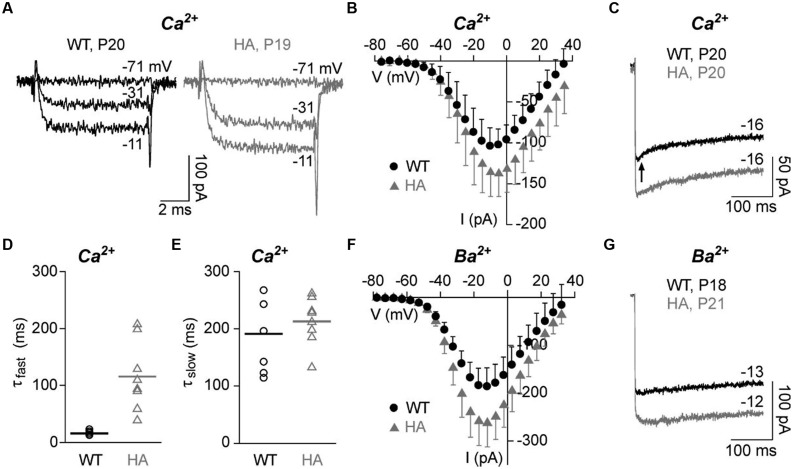
FIGURE 7.
Ca2+ and Ba2+ currents in adult IHCs (P18–21) of Cav1.3DCRDHA/HA and WT littermates. (A) Selected ICa traces (10 mM Ca2+) of a WT (black) and a Cav1.3DCRDHA/HA (HA, gray) mouse IHC after depolarization from a holding potential of -86 mV for 8 ms to the indicated voltages. (B) Corresponding averaged I–V curves from 10 WT (black, mean + SD) and 12 Cav1.3DCRDHA/HA IHCs (gray, mean – SD) taken between 7 and 8 ms after start of the depolarizing pulse. (C) Representative traces of ICa inactivation of WT (black) and a Cav1.3DCRDHA/HA (gray) IHC during a 300-ms depolarizing step to Vmax. The arrow indicates the early phase with faster inactivation absent in Cav1.3DCRDHA/HA and in Ba2+ recordings. (D) Parameters of ICa inactivation of 8 WT and 8 Cav1.3DCRDHA/HA IHCs were obtained by fitting peak current traces from 300 – ms test pulses with a double-exponential function. Individual data points and means (lines) are shown. The fast (τfast) inactivation time constant was significantly increased (p < 0.01) and showed a higher variance between individual IHCs in Cav1.3DCRDHA/HA IHCs. (E) The slow (τslow) inactivation time constant was not different between genotypes. (F) Averaged I–V curves of IBa with 10 mM Ba2+ as charge carrier from 9 WT (black, mean + SD) and 8 Cav1.3DCRDHA/HA (gray, mean – SD) IHCs between 7 and 8 ms after start of the depolarizing pulse. (G) Representative traces of IBa inactivation of a WT (black) and a Cav1.3DCRDHA/HA (gray) IHC during a 300 ms depolarizing step to Vmax.

