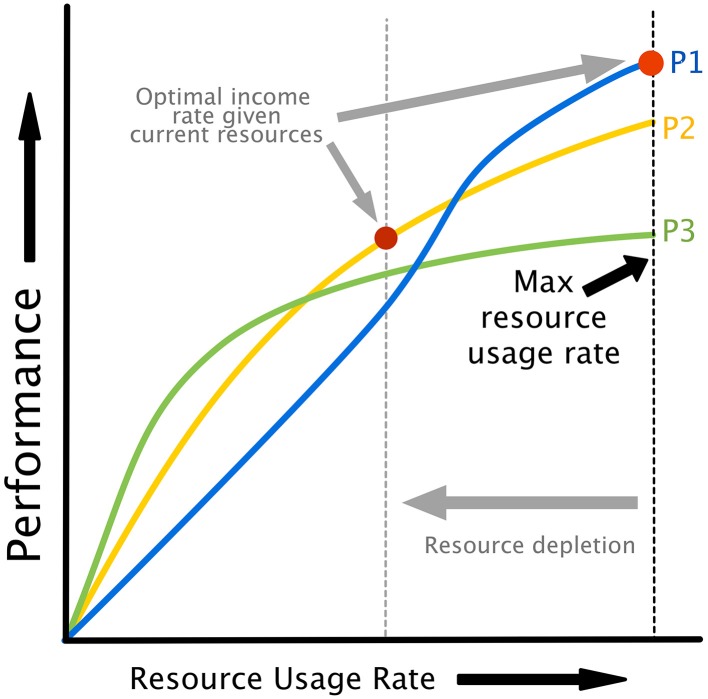
Figure 3.
Performance curves illustrating the relationship between resource utilization and performance. Different curves can represent either different policies/strategies for the same task or different tasks. Note that as resources are depleted, the maximum possible energy utilization rate drops (see Figure 2C), creating the possibility of a different strategies or task being optimal based on energy dynamics alone. This provides a natural explanation for task or strategy switching as a result of fatigue.

