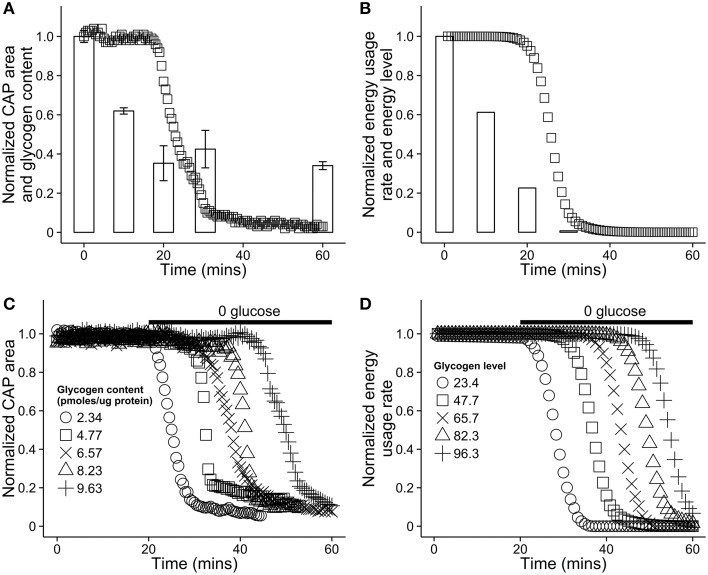
Figure 4.
Comparison of the energy dynamics of our model with the dynamics of astrocytic glycogen and compound action potential (CAP) area in vitro in a mouse optic nerve as reported in Brown et al. (2003). (A) Recorded CAP area in a mouse optic nerve (squares) and glycogen content (bars). The nerve was stimulated in a solution with no glucose. Note that glycogen is not further depleted after reaching ≈25% of its original level. Figure recreated using data from Brown et al. (2003). (B) A simulation of the same situation as (A) using our model. To simulate aglycemic conditions, the energy flow from the capillary, EB was set to 0 for the duration of the simulation. (C) Recorded CAP area in the mouse optic nerve in vitro as a function of time and the initial glycogen content in nearby astrocytes. At 20 min, the solution was replaced with a solution containing no glucose. Figure recreated using data from Brown et al. (2003). (D) A simulation of the same situation as (C) using our model. The absence of glucose in solution was modeled by again setting EB = 0 at 20 min. In our model, astrocytic energy level ranges from 0 to 100, arbitrary units.

