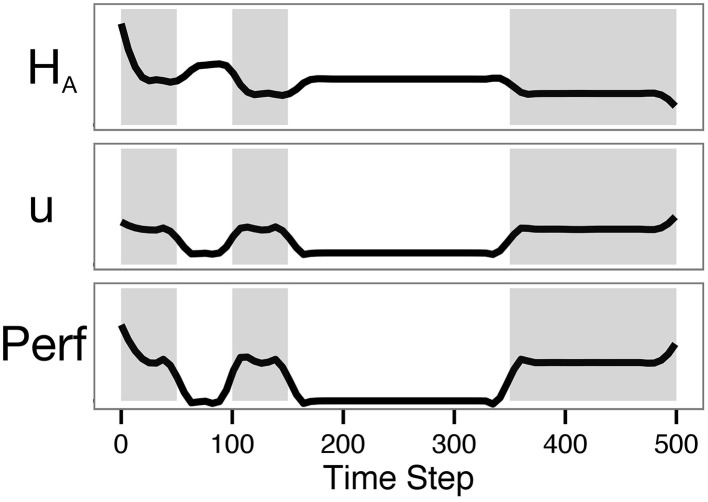
Figure 7.
The model predicts lower performance on the second task of a dual-task paradigm. The plot shows results from Simulation 2, with zero intrinsic cost and a lookahead of 500. Shading indicates periods in which the agent could be rewarded (on-task periods). Note that overall performance in the second shaded period is lower than performance in the first.

