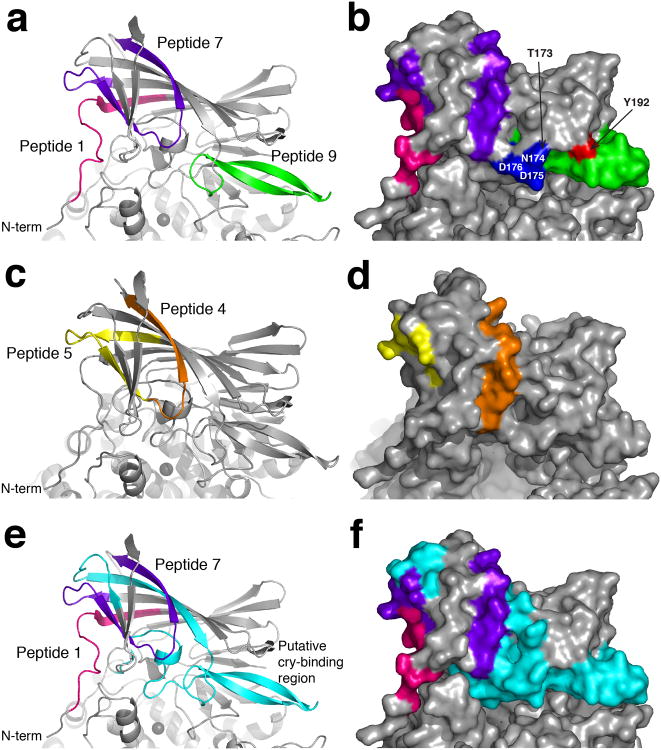
Figure 7. Location of predicted B and T cell epitopes on domain I of AnAPN1.
Peptides 1, 7 and 9 are shown in pink, purple and green respectively in (a) cartoon and (b) surface representation. The surface exposed residues of the first 5 residues (blue) and the last 3 residues (red) of peptide 9 are labeled. Peptides 4 and 5, which together form peptide 7, are shown in orange and yellow respectively in (c) cartoon and (d) surface representation. Equivalent residues of the Cry1Aa toxin binding site on Bombyx mori (Supplementary Fig. 6) are mapped onto AnAPN1 in both (e) cartoon and (f) surface representation and shown in cyan. The Cry1Aa toxin binding site overlaps peptide 9 and is situated alongside peptide 7. Peptide 1 is shown in pink for reference.

