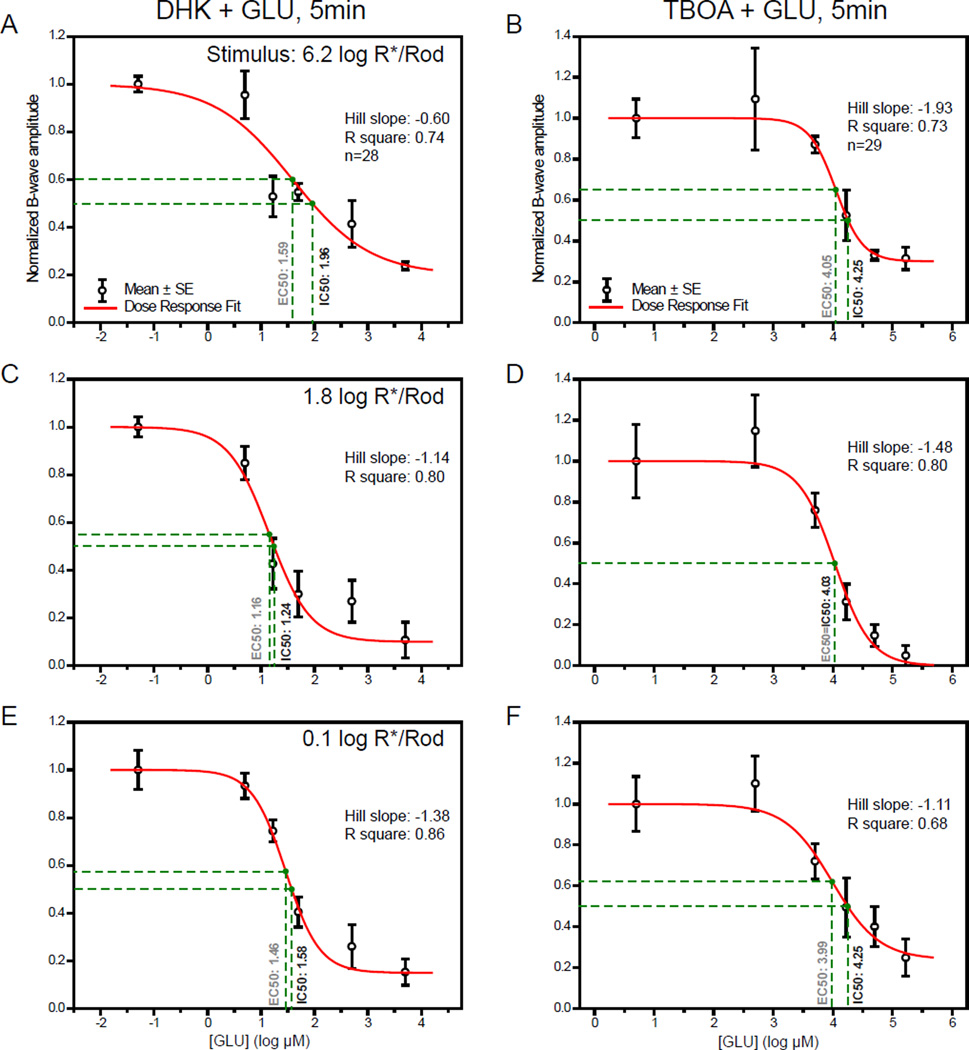
Figure 6.
Dose-response curves showing amplitudes of b-wave against log concentration of GLU measured at three different stimulus levels in the presence of either EAAT inhibitor. Individual data points and error bars denote value mean and standard error, respectively. Data were normalized to controls in which a threshold dose of the selected EAAT inhibitor, DHK or TBOA, was solely injected. Values in black and gray beside the vertical drop-lines represents IC50 and EC50, respectively.
(A,B) Dose-response curves measured with a strong rod-saturating zone IV stimulus within the operating range of cones. Using the highest concentration of GLU, the b-wave was inhibited by maximums of 76% and 69% when co-injected with DHK and TBOA, respectively.
(C,D) Curves measured with a moderate zone III stimulus. The b-wave was inhibited by maximums of 89% and 95%, nearly abolished, when co-injected with DHK and TBOA, respectively.
(E,F) Curves measured with a weaker zone II stimulus. The b-wave was largely reduced by about 85% and 75% when co-injected with DHK and TBOA, respectively. At all three stimulus strengths, GLU had lower EC50 and IC50 values when co-injected with DHK, compared to those co-injected with TBOA.

