Figure 9.
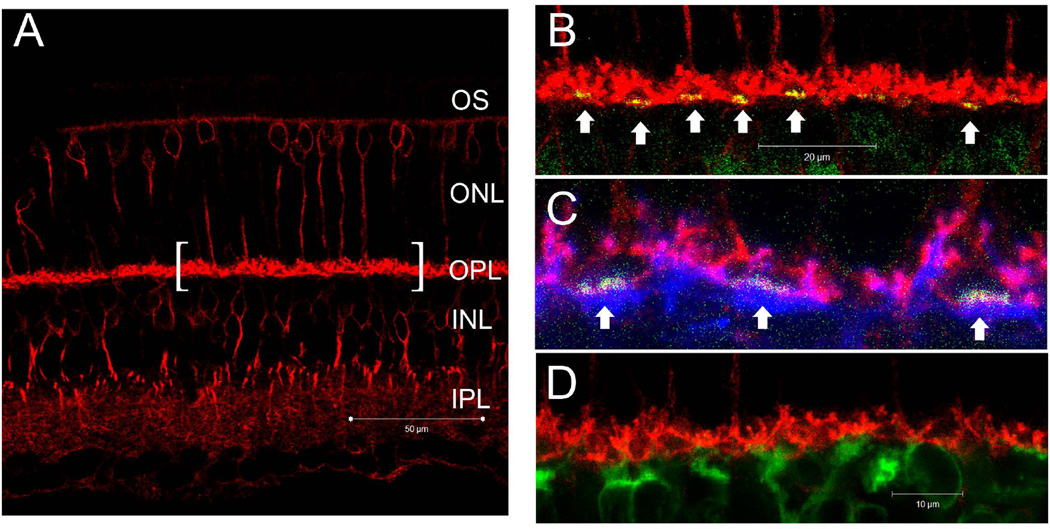
(A–C) Confocal microscopic images of retina from wild-type mice processed for EAAT2b (red), Goα (blue) and PNA (green). (A) EAAT2b–IR presented prominently in the OPL, and diffusely in the IPL without clear stratification. Some of the somas (possible cones) in the ONL and INL were also stained. A segment of OPL is presented as (B) and (C) at higher magnification. (B) EAAT2b–IR was present only in the half of the OPL that is distal to PNA staining. The dense spherically shaped staining in red is likely rod terminals. On the other hand, overlapped staining of PNA and EAAT2b resulted in the yellow color on cone pedicles (arrows). (C) Goα-IR presented mainly in the half of the OPL that is proximal to PNA staining. There was no obvious overlapping between Goα and EAAT2b staining, suggesting that EAAT2b is not present on the dendrites of DBCs. (D) The lack of overlap between EAAT2b (red) and PKCα (green) staining suggests that EAAT2b is not present on DBCRs.

