
Figure 8. Raman spectra of SnO2 NPs before and after the anaerobic and aerobic CO and ethanol oxidation reactions.
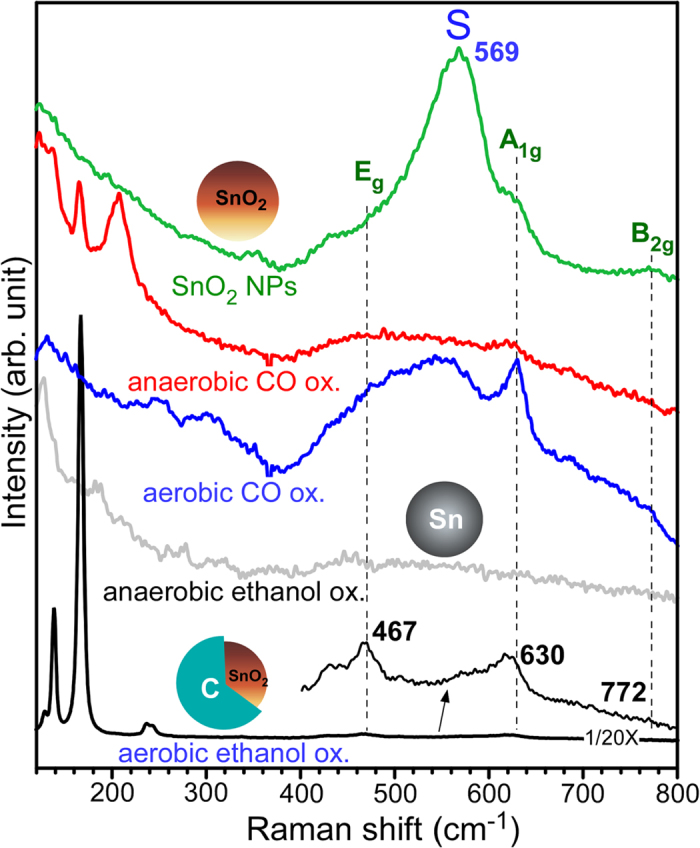
A laser intensity of 0.25 mW was used for SnO2@C core-shells, and 5 mW was used for other samples.
Official websites use .gov
A
.gov website belongs to an official
government organization in the United States.
Secure .gov websites use HTTPS
A lock (
) or https:// means you've safely
connected to the .gov website. Share sensitive
information only on official, secure websites.
A laser intensity of 0.25 mW was used for SnO2@C core-shells, and 5 mW was used for other samples.