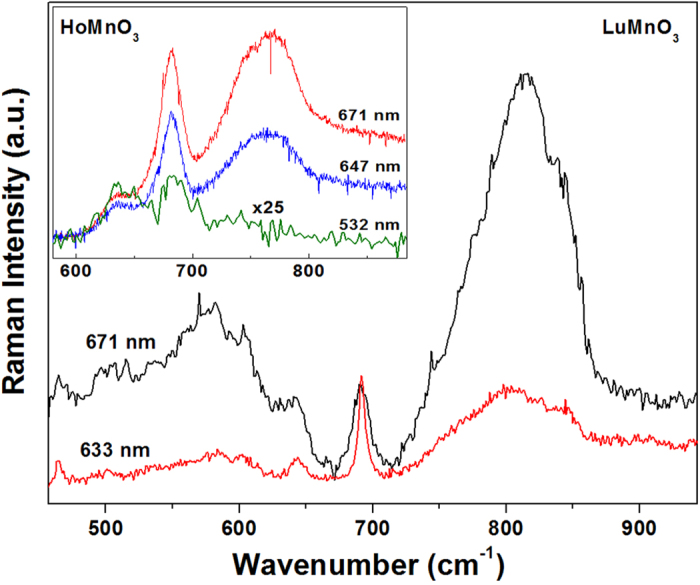
Figure 2. Raman spectra of hexagonal LuMnO3 single crystal at 21 K obtained in the  configuration using 671 nm and 633 nm lasers.

The intensities are normalized by the intensity of A1 phonon at 693 cm−1. (The spectra of 671 and 633 nm laser exciations were taken with J-Y T64000 and LabRaman system, respectively. The difference of linewidth between these two spectra would be due to intrinsic linewith broadening by the two different Raman systems.) Inset shows Raman spectra of HoMnO3 thin film obtained in the  configuration using 671 nm, 647 nm, and 532 nm lasers, taken from our previous work22.
