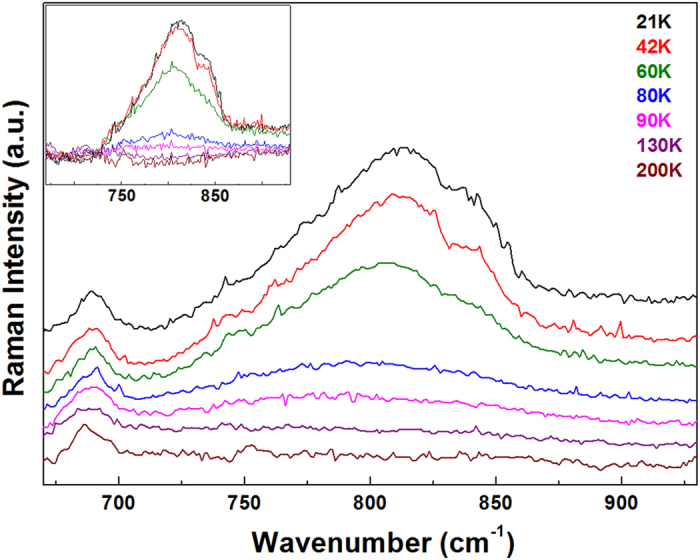
Figure 3. Temperature dependent (20 K–200 K) Raman spectra of hexagonal LuMnO3 single crystal in the  configuration.

Only seven representative spectra are shown in the figure. Each spectrum is shifted in y-direction for clarity. The inset shows the difference Raman spectra against the spectrum taken at 110 K.
