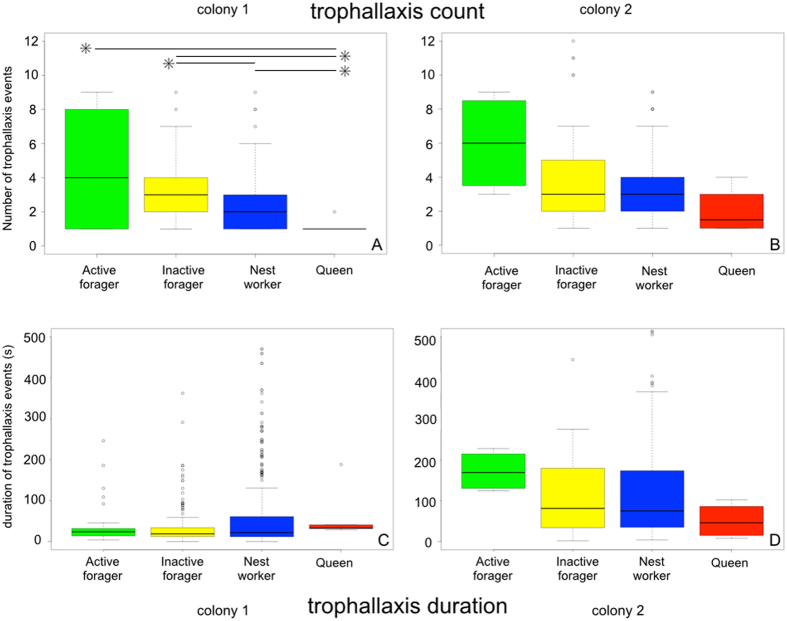
Figure 1. Trophallaxis count and duration.
(a,b) Trophallaxis count and (c,d) duration as a function of ant behavioural classification. Asterisks represent statistically significant differences between groups (Table S3b). Black lines represent the median values, boxes represent the range of values in the 1st through 3rd quartiles, and whiskers represent 1.5 times the inter-quartile range.

