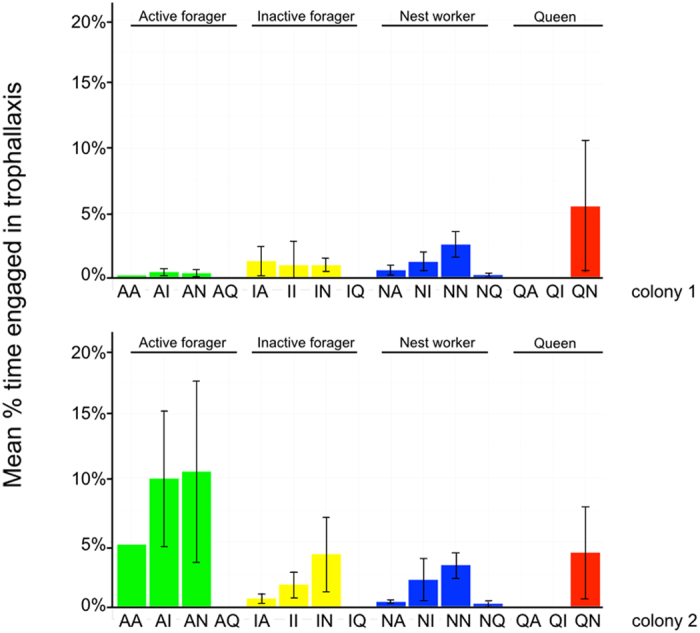
Figure 3. Trophallaxis as percentage of total ant-time budget.

Barplots showing the mean percentage of total time budget for each dyadic interaction between ant functional groups over all eight nights for each colony, error bars are +/− st. dev.

Barplots showing the mean percentage of total time budget for each dyadic interaction between ant functional groups over all eight nights for each colony, error bars are +/− st. dev.