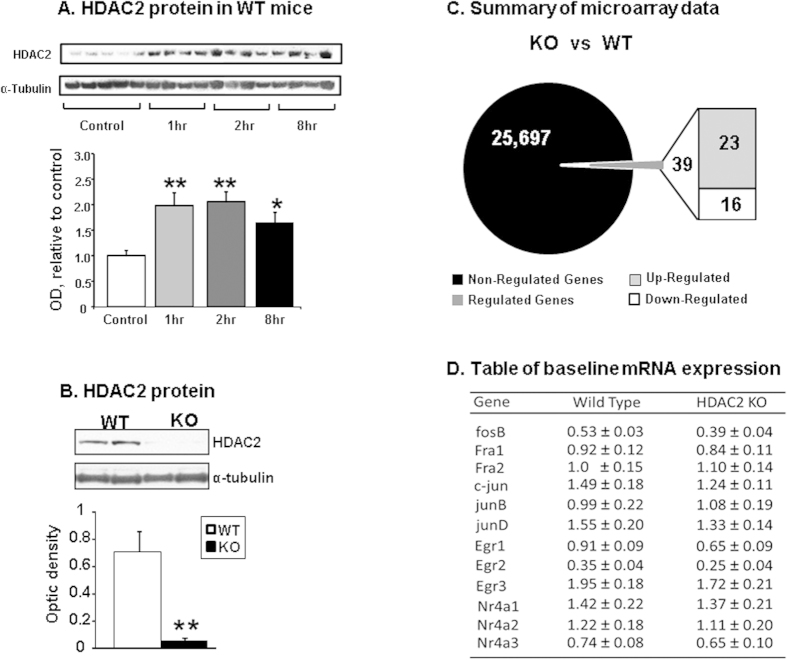
Figure 1. WT and HDAC2KO mice show no differences in baseline IEG mRNA levels.
(A) METH caused increased HDAC2 protein accumulation in nuclear fractions of NAc from WT mice. The graphs show results from Western blot analyses (N = 6–7 per group) using a specific antibody against HDAC2. The values were normalized to α-Tubulin levels. (B) HDAC2KO mice show little HDAC2 protein expression in the NAc relative to WT mice (N = 4 per group) (C) Microarray analyses (N = 4 mice per group) revealed that only a few genes were differentially expressed in the NAc of HDAC2 mice. The total number of non-regulated genes represented in black and regulated genes is represented in dark grey in the circle representing the total number of probes. The number of genes with increased expression in HDAC2KO mice is shown in the light grey box and the number of genes with decreased expression is shown in the white box. (D) RT-qPCR analyses validated the microarray data showing similar IEG baseline mRNA expression between the two genotypes. The table shows expression levels of IEGs normalized to Clathrin. Values represent means ± SEM (N = 6–8 per group) Key to statistics: Significance was determined by using ANOVA or unpaired Student t test *p < 0.05, **p < 0.01.

