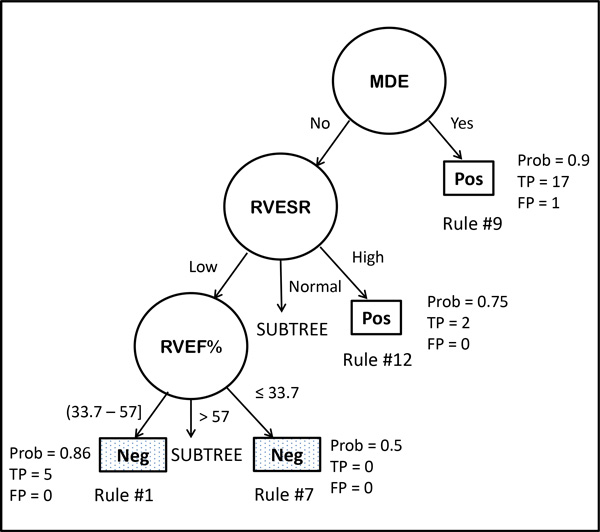
Figure 2.

A portion of the Bayesian Decision Tree model from BRL is depicted to visualize the classification rules. The predictor variables are shown in circles, and their values along each branch from the root of the tree to the leaf node depicted as a rectangle, represents a classification rule within the model. The rectangular leaf node represents the target variable, MRDx value for positive (Pos) or negative (Neg) finding of cardiomyopathy. Four rules are shown with some associated statistics such as the posterior probability (Prob) of the rule, and the numbers of true positives (TP) and false positives (FP) covered by the rule. Two of the subtrees are not shown. From this tree, we can easily spot areas where evidence is weak, strong, or could be combined. The variables shown include Myocardial Delayed Enhancement (MDE), Right Ventricular End Systolic Volume Range (RVESVR), and the Right Ventricular Ejection Fraction (RVEF%).
