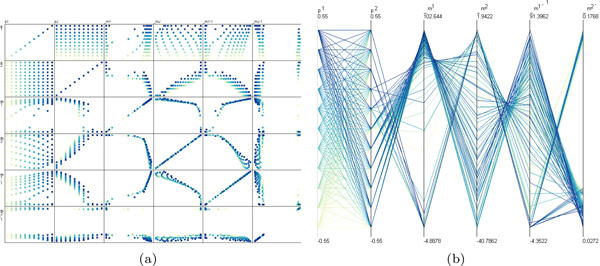
Figure 2.

Alternative visualisations of the data shown in Figure 1. (a) A scatterplot matrix does not clearly show the multi-way correlations that appear as nested patterns in Figure 1(a). (b) Parallel coordinates require additional interaction, such as filtering, to identify these patterns. For both approaches, simple user interaction such as selection, is more complicated than with our method.
