
Figure 5.
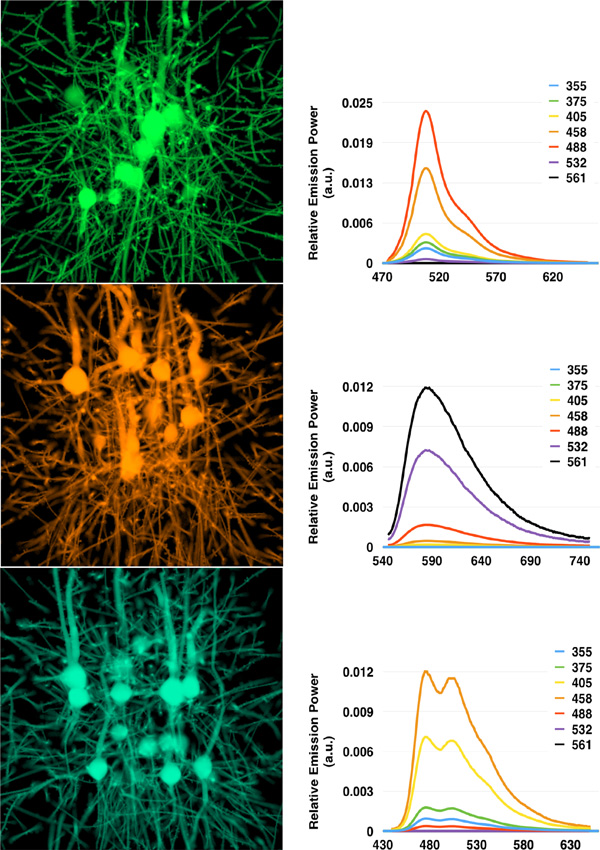
In silico optical sectioning. (Left) Synthetic optical sections generated from the GFP- (top), RFP- (middle), and CFP-tagged (bottom) virtual specimens excited with maximum excitation wavelength. (Right) Emission SPDs measured from the rendered images at different excitation wavelengths between 355 and 561 nm. The curves are normalized to the SPD resulting at the maximum excitation wavelength for each respective case. The x-axis of the SPDs represents the wavelength in nm.