
Figure 1.
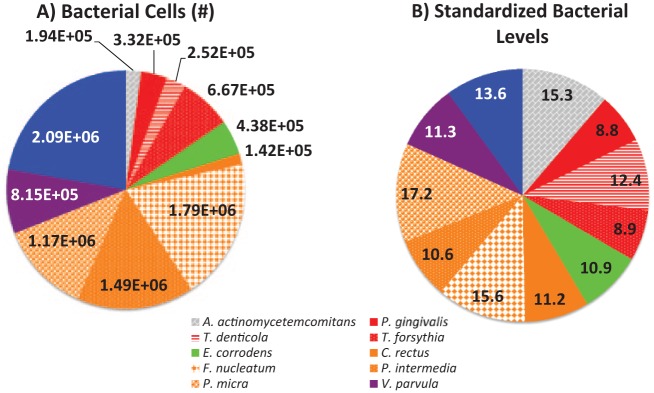
(A) Average nonstandardized bacterial cell counts and (B) standardized bacterial levels (in standard deviation units) among 1,188 subgingival plaques collected from 297 particiapants enrolled in the Oral Infections, Glucose Intolerance and Insulin Resistance Study, 2011–2013.