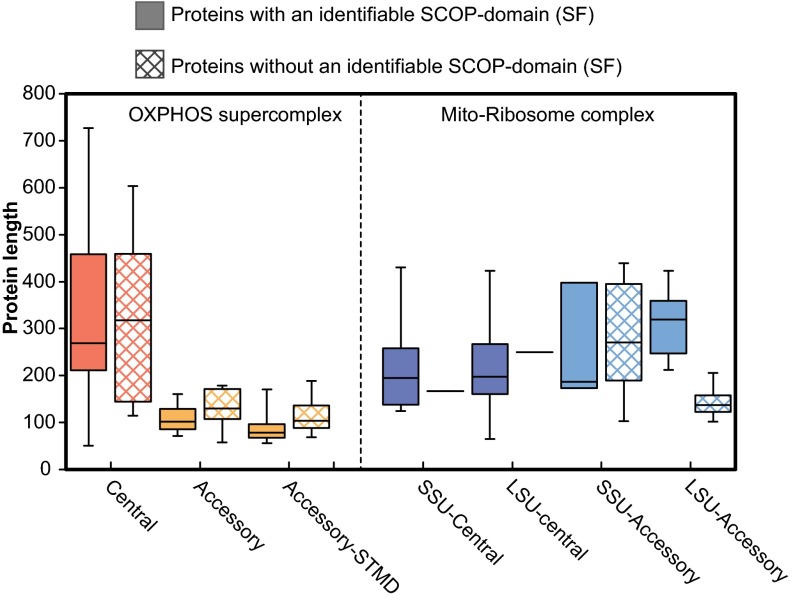
Fig. 3.
Comparison of protein lengths of the core and accessory proteins. Length distribution of the core and accessory proteins in the OXPHOS supercomplex and the mitochondrial ribosomal complex were compared between proteins for which a SF-domain could be assigned and proteins in which a SF-domain could not be identified. For each distribution center, the lines show the medians; box limits indicate the 25th and 75th percentiles; whiskers extend to extreme data points.

