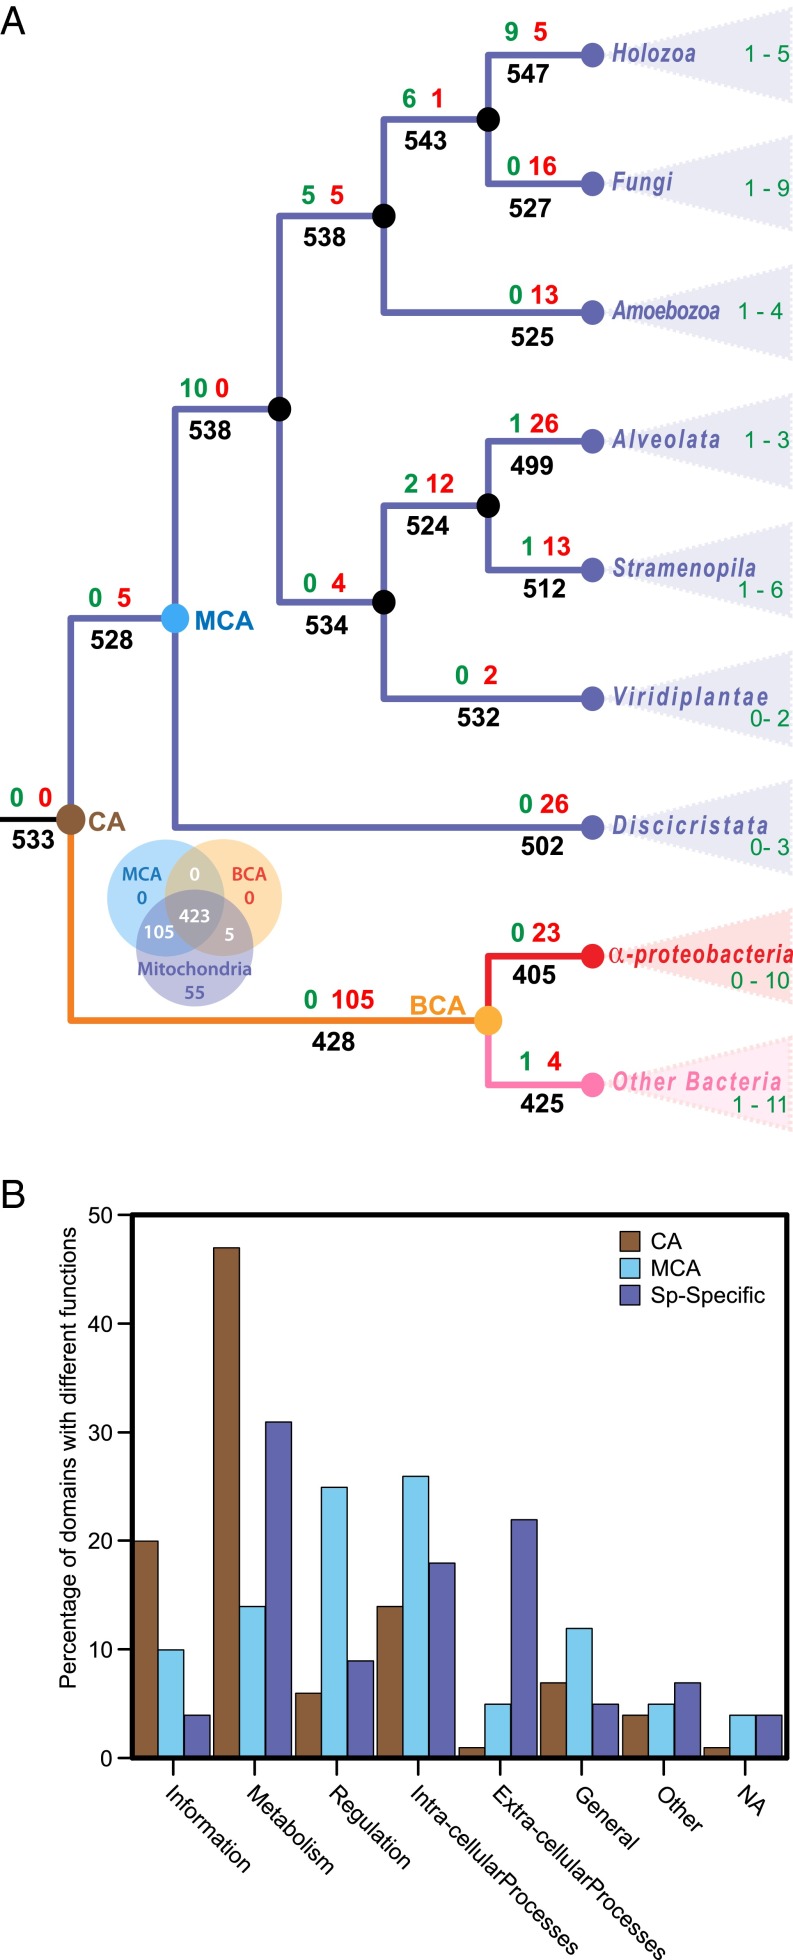
Fig. 5.
Ancestral reconstruction analysis of SF-domains in the mitochondrial proteome. (A) Flux of SF-domains in the mitochondrial proteome during evolution of eukaryotes and bacteria. Parsimonious reconstruction of domain flux is mapped onto a eukaryote phylogeny rooted with bacterial outgroup. Numbers at nodes show the number of SF-domains inferred to have been gained (green), lost (red), and the total number present at each node or branch (black) along the phylogeny. Only the major internal nodes are shown for clarity. Colored nodes represent the Common Ancestor of eukaryotes and bacteria (CA) (brown); Mitochondrial Common Ancestor (MCA) (blue); Bacterial Common Ancestor (BCA) (orange). Because the number of gains and losses varies between species, only a range from a minimum to a maximum in each clade is shown here. Details of flux for all species are shown in SI Appendix, Fig. S4. (B) A comparison of the functions associated to SF-domains estimated to be in the CA of eukaryotes and bacteria, MCA, and species specific SF-domains (Sp-specific). Bars represent the percent of SF-domains associated with a functional category.

