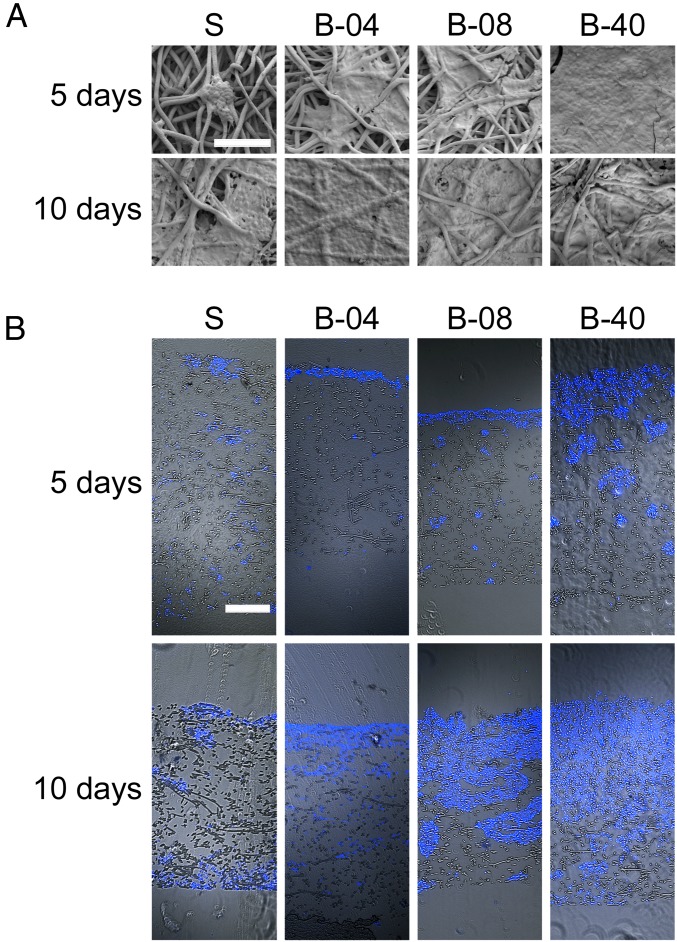
Fig. 2.
Effect of flow perfusion on ES cell morphology and distribution. (A) SEM micrographs of the surface of scaffolds for the different groups examined (S, static; B-04, 0.04 mL/min; B-08, 0.08 mL/min; and B-40, 0.40 mL/min). Scale bar represents 100 μm in all micrographs. (B) Fluorescence microscopy of the cross section of scaffolds. Brightfield images of scaffold fibers are overlapped with ES cells fluorescently stained with DAPI (blue staining). (Scale bar, 200 μm.)

