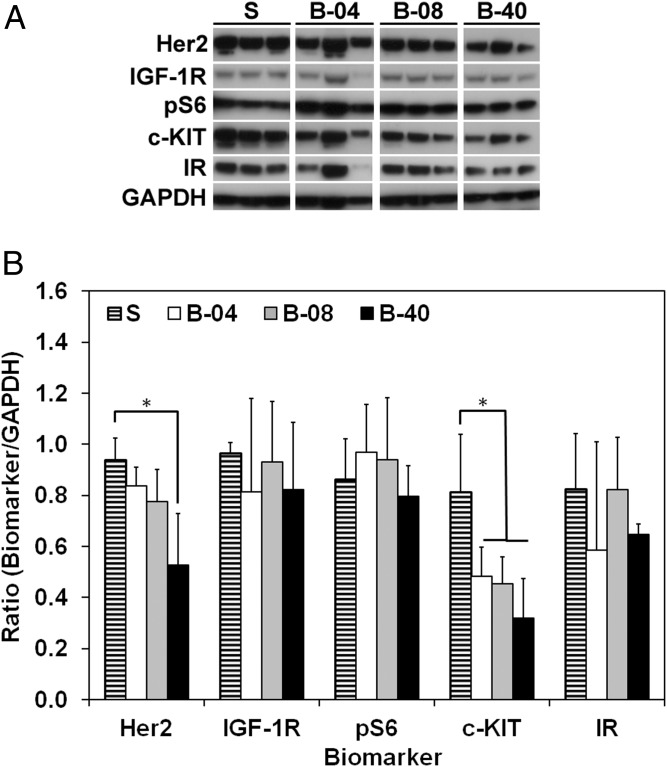
Fig. 3.
Effect of flow-derived shear stress on ES cell signaling transduction. (A) Western blot after 10 d of culture for the different groups examined (S, static; B-04, 0.04 mL/min; B-08, 0.08 mL/min; and B-40, 0.40 mL/min). (B) Histogram analysis for the proteins shown in A. Signal density is normalized to GAPDH content. and error bars represent the SD for n = 3 samples (*P < 0.05).

