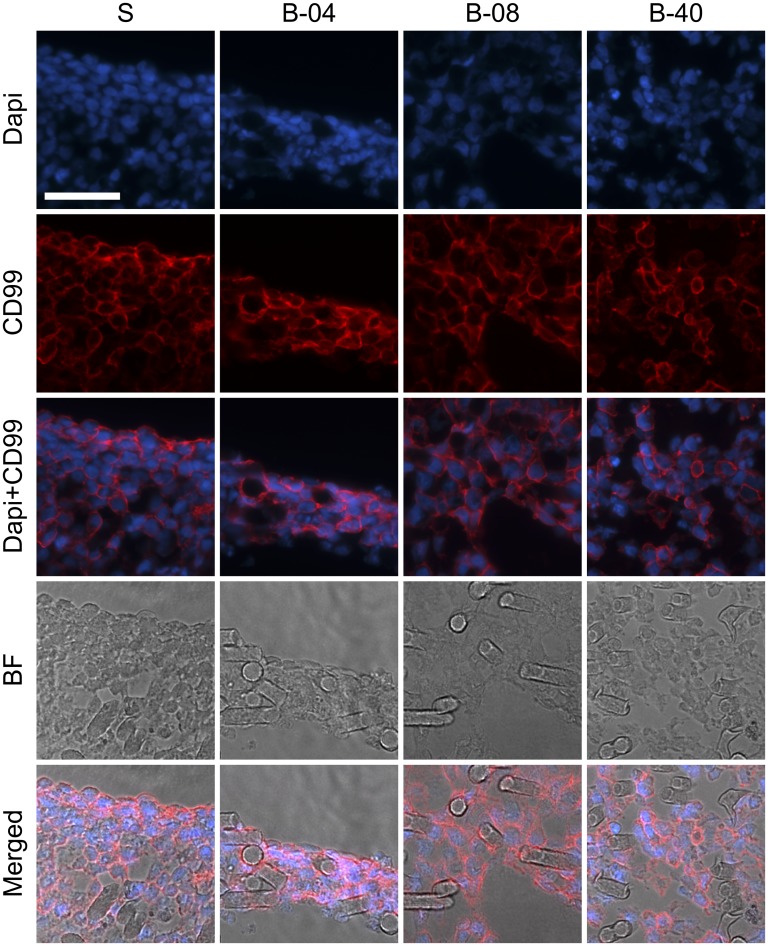
Fig. S2.
Immunofluorescent analysis of ES cell culture under static and flow perfusion conditions. After 10 d of culture, constructs for the different experimental groups (S, static; B-04, 0.04 mL/min; B-08, 0.08 mL/min; and B-40, 0.40 mL/min) were stained for surface marker CD99 (red) and nuclei using DAPI stain (blue). Brightfield images show the location of ES cells along PCL fibers (BF). (Scale bar, 50 μm.)

