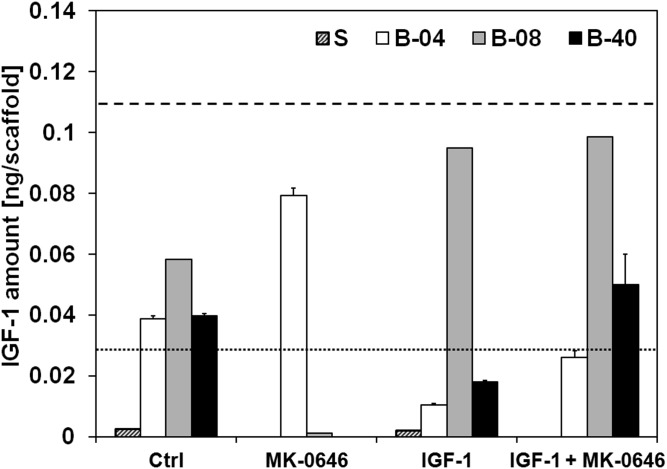
Fig. S5.
Levels of IGF1 ligand after 2 d of culture under static and flow perfusion conditions. The amount of IGF1 ligand per scaffold produced by ES cells under static and flow perfusion conditions (S, static; B-04, 0.04 mL/min; B-08, 0.08 mL/min; and B-40, 0.40 mL/min) is illustrated by the respective histograms. Basal levels of IGF1 ligand in the complete media are shown as a reference for medium prepared with FBS (broken line) or charcoal-stripped FBS (dotted line). Error bars represent the SD (n = 3).

