Fig. 2.

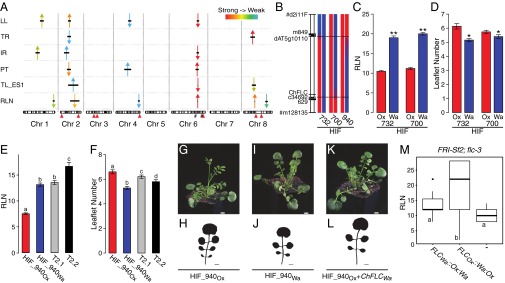
Natural variation in the regulatory sequences of ChFLC underlies phenotypic diversity in leaf morphology and flowering time in C. hirsuta. (A) Schematic representation of QTL mapped in Ox × Wa RILs using composite interval mapping for six traits. Shown from top to bottom are leaflet number (LL), terminal rachis length (TR), inter rachis length (IR), petiole length (PT), terminal leaflet shape (TL-ES1), and rosette leaf number (RLN). Leaf traits were quantified on the fifth rosette leaf. Horizontal black lines indicate the 1.5 logarithm of odds support interval for QTL. The magnitude of QTL effects is indicated by a color gradient ranging from red (strong effect) to light blue (weak effect). Arrowheads indicate the direction of the QTL effect by pointing either upward or downward according to whether the Wa allele at the QTL increases or decreases the trait value when substituted for the Ox allele. Red arrowheads below the chromosomes indicate the position of characterized leaf patterning genes. From left to right, these are: STM, CUC3, CUC1, TCP4, MIR164A, RCO, BP, and CUC2. Hashtags on chromosome 6 indicate markers used to validate QTL-LG6. (B) Schematic diagram of QTL fine mapping using HIFs. Genetic markers are shown on the left, and Ox (red) and Wa (blue) genotypes are indicated on chromosomes of three different HIFs. Black dotted lines mark the boundaries of the fine mapped region. (C and D) Validation of ChFLC allelic effects using HIFs; the Ox allele (red) reduces RLN (C) and increases leaflet number (D) compared with the Wa allele (blue) (n = 15). *P < 0.05; **P < 0.01 (Student’s t test). (E and F) Transgenic complementation of HIF940 carrying the ChFLCOx allele (HIF940Ox; red bar) with the ChFLCWa genomic locus (two independent transgenic lines shown; gray and black bars). (E) RLN is fully complemented to HIF940Wa value (blue bar) in T2.1 (gray bar) and further increased in T2.2 (black bar). (F) Leaflet number is partially complemented to HIF940Wa value (blue bar) in T2.1 (gray bar) and T2.2 (black bar). Significant differences between genotypes determined by ANOVA and post hoc Tukey’s test are indicated by letters; P < 0.05 (n = 15 per genotype). Leaflet number was quantified in rosette leaf five. Data are reported as means ± SD. (G–L) Photographs of plants (G, I, and K) and silhouettes of rosette leaf five (H, J, and L) of transgenic lines and HIFs described in E and F. (M) Boxplot of RLN in A. thaliana FRI-Sf2;flc-3 untransformed (−) or transformed with constructs containing the ChFLC genomic locus from Wa and Ox where the first intron is exchanged (FLCWa::Ox:Wa and FLCOx::Wa:Ox). Significant differences between genotypes determined by ANOVA and post hoc Tukey’s test are indicated by letters; P < 0.01 (n = 30 per genotype). (Scale bars: 1 cm.)
