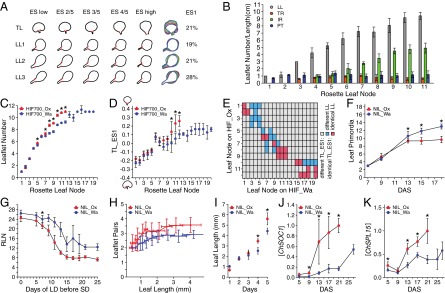
Fig. 3.

Heterochronic variation caused by allelic diversity at ChFLC underlies natural variation in C. hirsuta leaf morphology. (A and B) C. hirsuta heteroblasty is characterized by continuous changes in leaf shape and size. (A) Extended eigenshape analysis was performed on the terminal leaflet (TL) and first (LL1), second (LL2), and third (LL3) pairs of lateral leaflets along the heteroblastic series of Ox. Models describing shape variation along the first eigenshape axis (ES1) and the variance explained by ES1 are shown. (B) Quantification of leaflet number (LL), terminal rachis (TR), inter rachis (IR), and petiole (PT) length in successive rosette leaves of Ox. (C and D) Leaflet number (C) and terminal leaflet shape (TL-ES1; D) in successive rosette leaves of HIF700 segregating for ChFLC [n = 15 per genotype (C); n = 5 per genotype (D)]. (E) Comparison of leaflet number between nodes of HIFOx and HIFWa with identical terminal leaflet shape (TL_ES1). Pairs of nodes with different TL_ES1 are shown in gray, and those with identical TL_ES1 in either blue or red depending on whether the leaflet number differed significantly between these nodes or not, respectively. Results were obtained by analyzing HIF732 and HIF700 jointly. (F) Leaf primordia visible at the shoot apical meristem plotted against DAS (n = 15 per genotype). No significant differences in leaf initiation rate are observed before 13 DAS when ChFLCOx has flowered. (G) Photoperiod sensing shift experiment: rosette leaf number (RLN) of NILs plotted against the number of LD experienced before transfer to SD. Asterisk indicates the point on the x axis when both genotypes showed a significant response to floral induction (P < 0.05 by Student’s t test). (H) Average number of leaflet pairs of NILs plotted against a moving average of leaf length. (I) Length of the ninth rosette leaf measured for five consecutive days during early ontogenesis (G and H; n = 15 per genotype). (J and K) Expression levels of ChSOC1 (J) and ChSPL15 (K), measured by quantitative RT-PCR (qRT-PCR), increase significantly faster in NIL_Ox than NIL_Wa during development. Mean values and SDs are shown. *P < 0.01 (Student’s t test).
