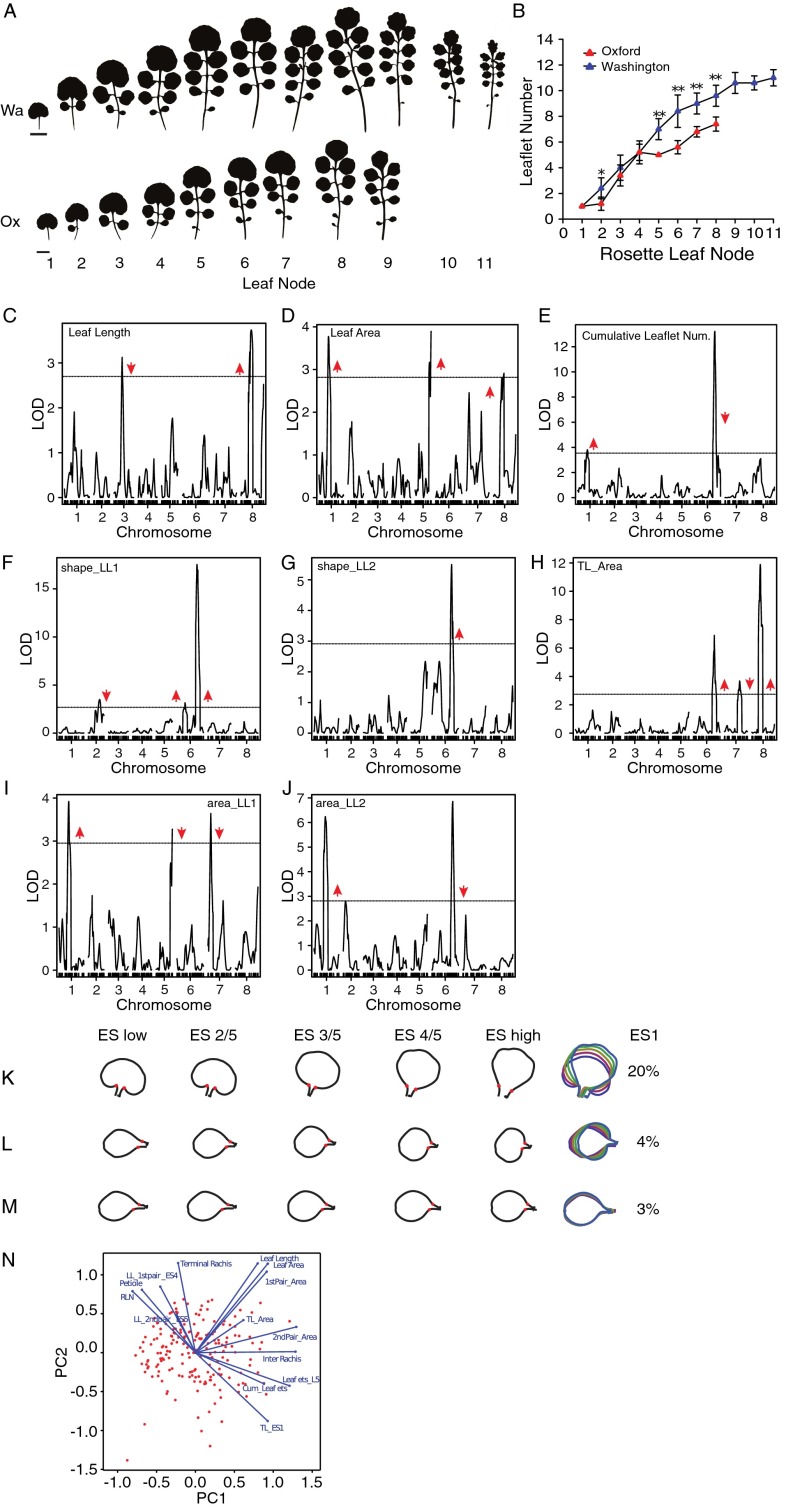
Fig. S1.
Further genetic and phenotypic characterization of the effects of QTL-LG6 on the heteroblastic progression. (A) Heteroblastic series of Wa (Upper) and Ox (Lower) parental strains. (B) Leaflet number quantification of the Ox and Wa parental strains along the heteroblastic series. Mean values are presented with SDs. Comparison of means was performed with a Student’s t test. *P < 0.05; **P < 0.01. (C–E) In addition to traits discussed in Fig. 2A, we performed QTL analysis for leaf length (C) and leaf area (D) of the fifth rosette leaf and for cumulative leaflet number produced by the first seven rosette leaves (E). (F–J) For the fifth rosette leaf, we also mapped QTL for the eigenscores ES1 of the first (F) and second (G) leaflet pairs, the area of the terminal leaflet (H), and the first (I) and second (J) leaflet pair. Horizontal black lines indicate the significance threshold corresponding to P = 0.05. Red arrowheads show the direction of the QTL effect and point upward or downward when the Wa allele at the QTL increases or decreases the trait value, respectively. (K–M) Shape models describing morphological variation along the ES1 of the terminal leaflet (K) and the first (L) and second (M) pairs of leaflets generated by phenotyping leaflet shape of rosette leaf 5 in the Ox × Wa F8 RIL population. The variance explained by ES1 is shown for each leaflet dataset. (N) Diagnostic biplot of the first two principal components generated by multivariate analysis of the 14 traits quantified in the RILs. Blue vectors represent traits, and red dots indicate individual RILs. The plot reveals how traits are correlated—e.g., blue vectors closest together or 180° apart represent traits that are most closely correlated; there is no correlation between traits if the angle between traits equals 90°.

