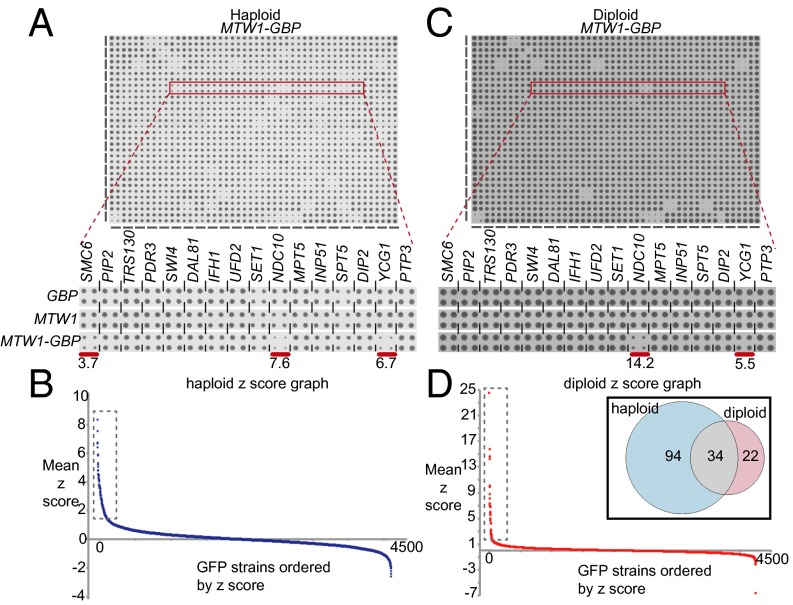
Fig. 2.
Mtw1 synthetic physical interactions. (A) An example of 384 yeast GFP strains each arrayed in quadruplicate. The MTW1-GBP construct is expressed in these strains and the growth of colonies on the plate are shown. (Inset) An example of 16 strains from the plate, three of which show growth restriction compared with the two controls (GBP and MTW1). The red bars indicate the three growth-restricted strains, with the z-score indicated. (B) Quantitation of the colony size allows us to calculate z-scores for each interaction (higher score indicates greater growth restriction). The strains are ranked based upon their z-score, with the most growth-restricted strains to the left. Only a relatively small subset of interactions affect growth; 128 strains have an average z-score greater than 1.5 (boxed group, full data in Dataset S1). (C) The same assay was repeated in heterozygously tagged diploid strains, where for each strain there is an untagged allele in addition to the GFP-tagged version. (Inset) The same 16 strains highlighted in A. (D) Quantitative analysis of the diploid screen shows that 56 strains are significantly restricted for growth (boxed group and Dataset S2). The inset Venn diagram indicating that a majority of the diploid SPIs (34 of 56) are common with those from the haploid screen.

