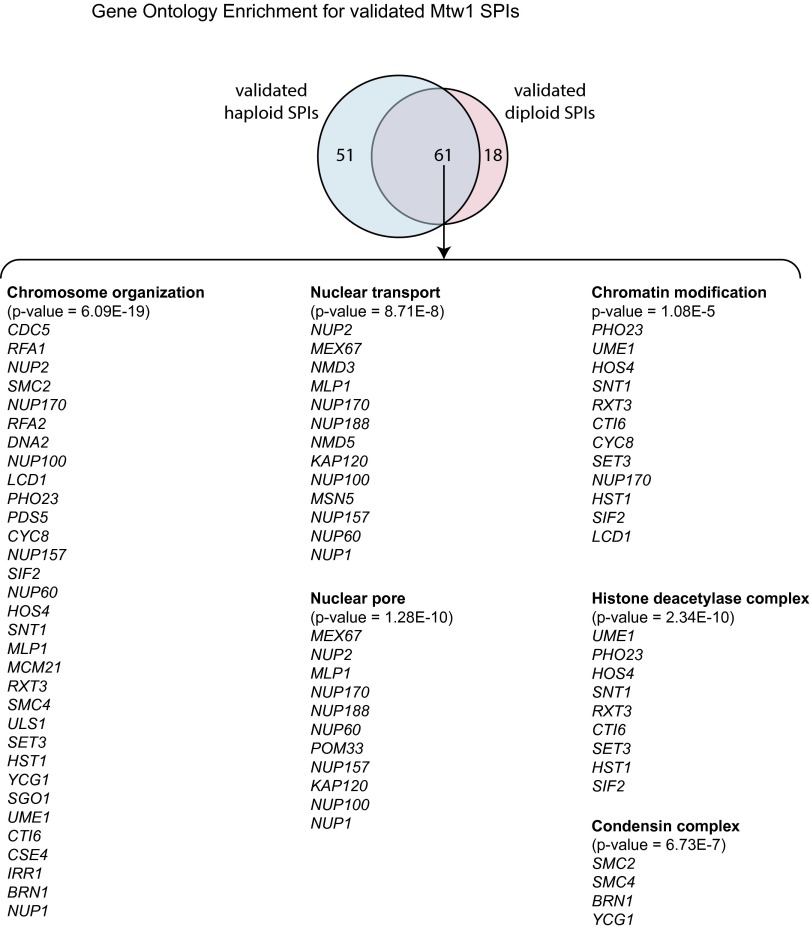
Fig. S2.
Gene ontology analysis of the Mtw1 SPIs. The output from “Gorilla” ontology enrichment analysis is illustrated (cbl-gorilla.cs.technion.ac.il/). The most statistically significant enrichments of functions and complexes are shown with the genes that fall within each category listed.

