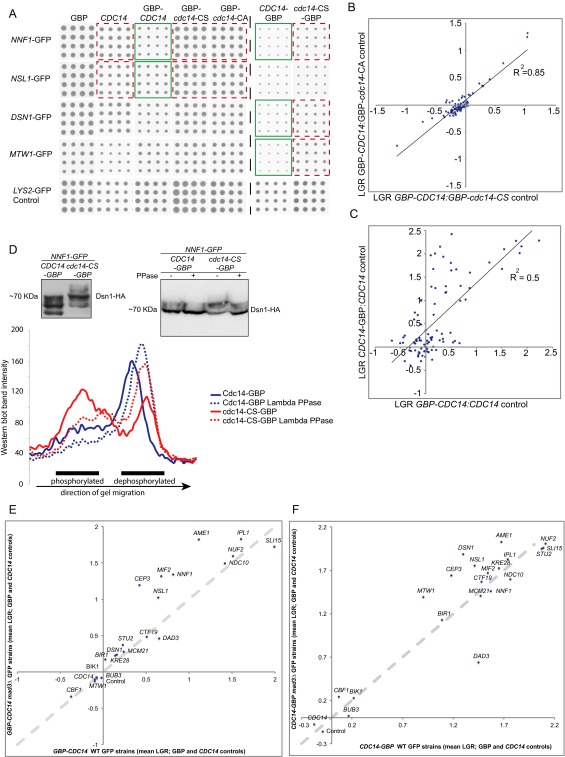
Fig. S6.
Cdc14-kinetochore SPIs. (A) An array of kinetochore GFP strains were arrayed at high density (16 replicates), members of the MIND complex are shown. Plasmids expressing a variety of Cdc14 constructs were transferred separately into each strain. SPIs that were identified by the ScreenMill software are highlighted (green for experiment, red for controls). (B) The two catalytically inactive N-terminal GBP fusions gave equivalent log growth ratios (LGRs) compared with the wild-type GBP-Cdc14. (C) The N-terminal and C-terminal GBP fusions to Cdc14 also give well-correlated SPI data (LGRs). (D) Proteins were extracted from Nnf1-GFP cells encoding Dsn1-3xHA, which also contained either a wild-type CDC14-GBP or cdc14-CS-GBP mutant plasmid. The protein was separated using gels containing Phos-Tag reagent to separate phosphorylated proteins, and the resulting blot shows the effect of recruiting Cdc14. Protein extracts from the same strains with or without Lambda phosphatase treatment where also compared, and band intensity was plotted on a line graph. We found significant protein degradation caused by the incubation at 30 °C, which is part of the phosphatase treatment. However, as quantitated in the line graph, it is clear that the higher band, which is largely absent when Cdc14 wild-type is recruited, is depleted by phosphatase treatment. This is viewed quantitatively in the line plot. (E and F) The four plasmid constructs (GBP-CDC14, CDC14-GBP, CDC14, and GBP) were introduced into 21 GFP-tagged strains detected as SPIs (including controls) with GBP-CDC14 or CDC14-GBP as before, but now in both wild-type and mad3∆ backgrounds, and arrayed with 16 replicates. The average of the CDC14 and GBP controls versus the GBP-CDC14 (E) or CDC14-GBP (F) experiment (mean LGR) were compared and plotted on a scatter-graph (wild-type on x axis and mad3∆ on y axis). (E) Deletion of MAD3 does not suppress any GBP-Cdc14 SPIs. However, several GBP-Cdc14 SPIs are stronger in a mad3∆ strain (CEP3, MIF2, NSL1, NNF1, and AME1). (F) Only one SPI, Cdc14-Dad3, is suppressed; however, the colony sizes of this comparison are very small and consequently their ratios are subject to larger errors. Several Cdc14-GBP SPIs increase the growth phenotype when MAD3 is deleted (MTW1, CEP3, DSN1, NSL1, and AME1). The dotted diagonal line indicates the position expected if the LGRs are the same in both wild-type and mad3∆ strains; points below this line would be suppressed by the mad3∆ allele.

