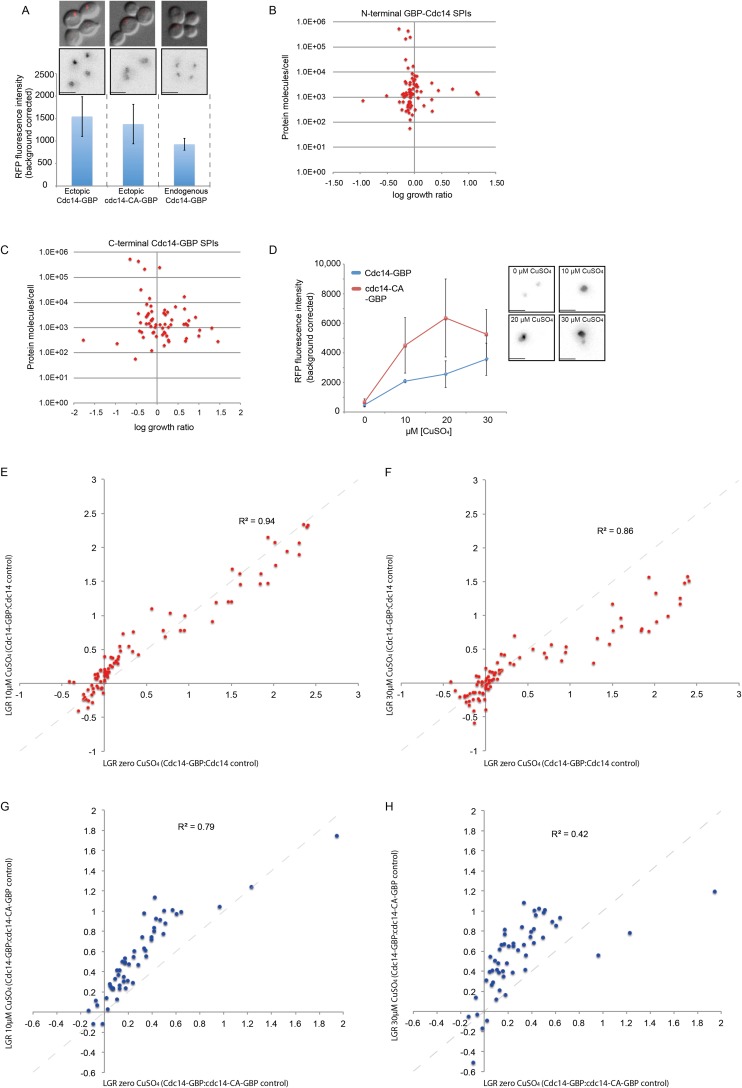
Fig. S7.
Stoichiometry analysis of Cdc14. (A) RFP fluorescence intensity of endogenously encoded Cdc14-GBP was compared with plasmid-encoded wild-type and mutant Cdc14-GBP without CuSO4 addition. Ectopically expressed Cdc14 (both wild-type and mutant) has ∼1.5× higher RFP signal than endogenously expressed Cdc14-GBP; error bars indicate SD of fluorescence intensity. (Scale bars, 5 µm.) (B and C) The strength of the Cdc14 SPI growth phenotype does not correlate with the amount of protein molecules per cell for the GFP-tagged proteins. (D) Fluorescence intensity of Cdc14-GBP and cdc14-CS-GBP with addition of CuSO4 to drive the expression from the plasmid. The RFP signal increases with higher concentration of copper in both wild-type and mutant strains; error bars indicate SD. (Inset) Examples of wild-type Cdc14-GBP at different concentrations of copper; beyond 30 µM copper overexpression of CDC14 becomes toxic to cells. We note that wild-type Cdc14 levels are lower than mutant, perhaps indicating partial toxicity of overexpression of CDC14. (Scale bars, 5 µm.) (E and F) Comparing Cdc14-GBP with Cdc14 control gave equivalent results on the different CuSO4 concentrations (0 µM and 10 µM or 30 µM CuSO4 each correlate well). (G and H) Comparing Cdc14-GBP with the mutant cdc14-CA-GBP control with both 0 µM and 10 µM CuSO4 correlates well, whereas 0 µM and 30 µM CuSO4 correlates to a lesser extent. The weaker correlation of 0 µM with 30 µM may be because of partial toxicity of this level of overexpression of CDC14.

