Fig. 1.
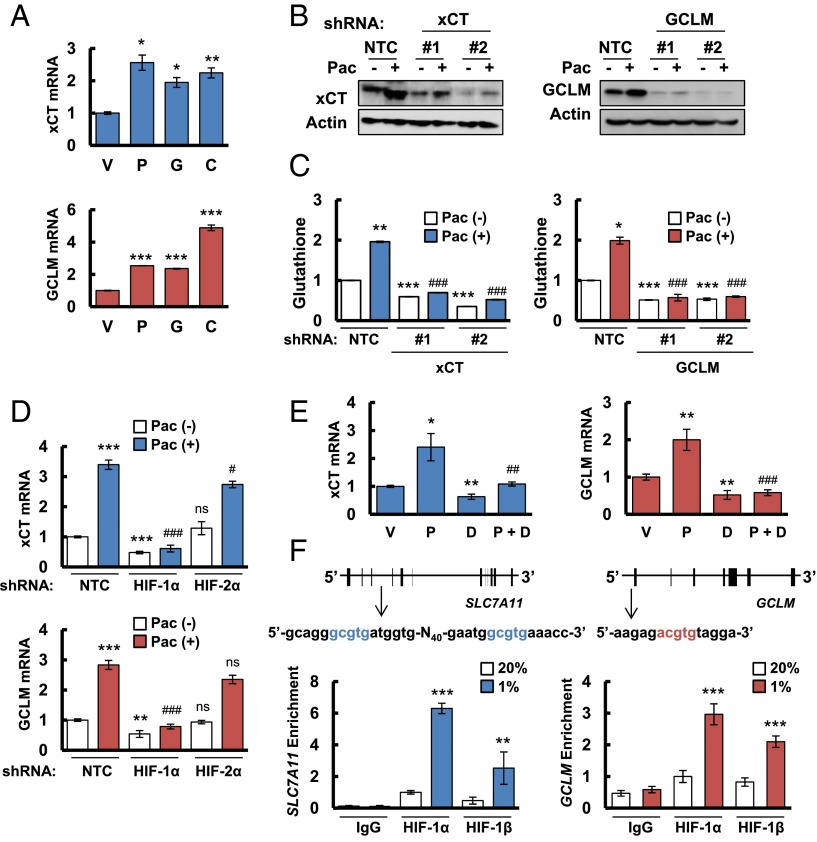
Chemotherapy induces glutathione synthesis in a HIF-1–dependent manner. (A) MDA-MB-231 cells were treated with vehicle (V), 10 nM paclitaxel (P), 10 nM gemcitabine (G), or 100 μM carboplatin (C) for 72 h. Aliquots of total cellular RNA were subjected to RT and qPCR to analyze xCT (SLC7A11) and GCLM mRNA expression. The results were normalized to cells treated with vehicle (mean ± SEM; n = 3). *P < 0.05, **P < 0.01, ***P < 0.001 vs. vehicle. (B) MDA-MB-231 subclones, which were stably transfected with an expression vector encoding nontargeting control (NTC) short hairpin RNA (shRNA), or vector encoding shRNA against xCT or GCLM, were treated without (-) or with (+) 10 nM paclitaxel (Pac) for 72 h, and immunoblot assays were performed to analyze xCT and GCLM protein expression. (C) MDA-MB-231 subclones were treated without or with 10 nM Pac for 72 h, glutathione levels were measured, and the results were normalized to NTC Pac (-) (mean ± SEM; n = 3). *P < 0.05, **P < 0.01, ***P < 0.001 vs. NTC Pac (-); ###P < 0.001 vs. NTC Pac (+). (D) MDA-MB-231 subclones, which were stably transfected with NTC vector or vector encoding shRNA against HIF-1α or HIF-2α, were treated without or with Pac for 72 h. RT-qPCR was performed to assay xCT and GCLM mRNA levels (mean ± SEM; n = 3). **P < 0.01, ***P < 0.001 vs. NTC Pac (-); #P < 0.05, ###P < 0.001 vs. NTC Pac (+); ns, not significant. (E) MDA-MB-231 cells were implanted into the mammary fat pad of female SCID mice. When tumor volume reached 200 mm3, mice were randomly assigned to treatment with saline (vehicle, V), Pac (P; 10 mg/kg on days 5 and 10), digoxin (D; 2 mg/kg on days 1–12), or Pac and digoxin (P + D). Tumors were harvested on day 12 for RT-qPCR analysis of xCT and GCLM mRNA. *P < 0.05, **P < 0.01 vs. vehicle; ##P < 0.01, ###P < 0.001 vs. Pac. (F) MDA-MB-231 cells were incubated at 20% or 1% O2 for 16 h, and ChIP assays were performed by using IgG or antibodies against HIF-1α or HIF-1β. Primers flanking candidate binding sites in the SLC7A11 and GCLM genes were used for qPCR, and the results were normalized to cells exposed to 20% O2 and immunoprecipitated with anti-HIF-1α (mean ± SEM; n = 3). **P < 0.01, ***P < 0.001 vs. 20% O2. The nucleotide sequences surrounding the HIF-1–binding sites (colored fonts) within intron 3 of SLC7A11 and the 5′-flanking region of GCLM are shown.

