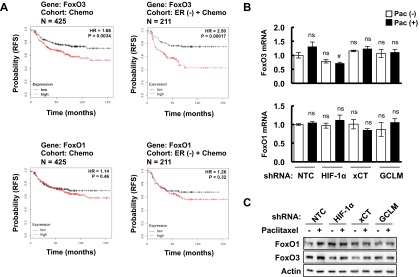
Fig. S4.

Analysis of FoxO1 and FoxO3 expression in patients and breast cancer cell lines treated with chemotherapy. (A) Kaplan–Meier analysis of relapse-free survival was performed based on clinical and molecular data from 425 breast cancer patients who received chemotherapy (Left) or from a subgroup of 211 ER (-) breast cancer patients who received chemotherapy (Right). The specimens were stratified according to levels of FoxO3 (Upper) or FoxO1 (Lower) mRNA in the primary tumor. High, FoxO mRNA levels greater than the median; Low, FoxO mRNA levels less than the median. The P value (log-rank test) and hazard ratio (HR) for each comparison are shown. (B) MDA-MB-231 subclones expressing the indicated shRNA were treated without or with paclitaxel for 72 h. RT-qPCR was performed to assay FoxO1 (Bottom) and FoxO3 (Top) mRNA levels (mean ± SEM; n = 3). #P < 0.05 vs. NTC Pac (+); ns, not significant. (C) MDA-MB-231 subclones were treated without or with paclitaxel for 72 h, and immunoblot assays were performed to analyze FoxO1 and FoxO3 protein expression.
