Fig. 4.
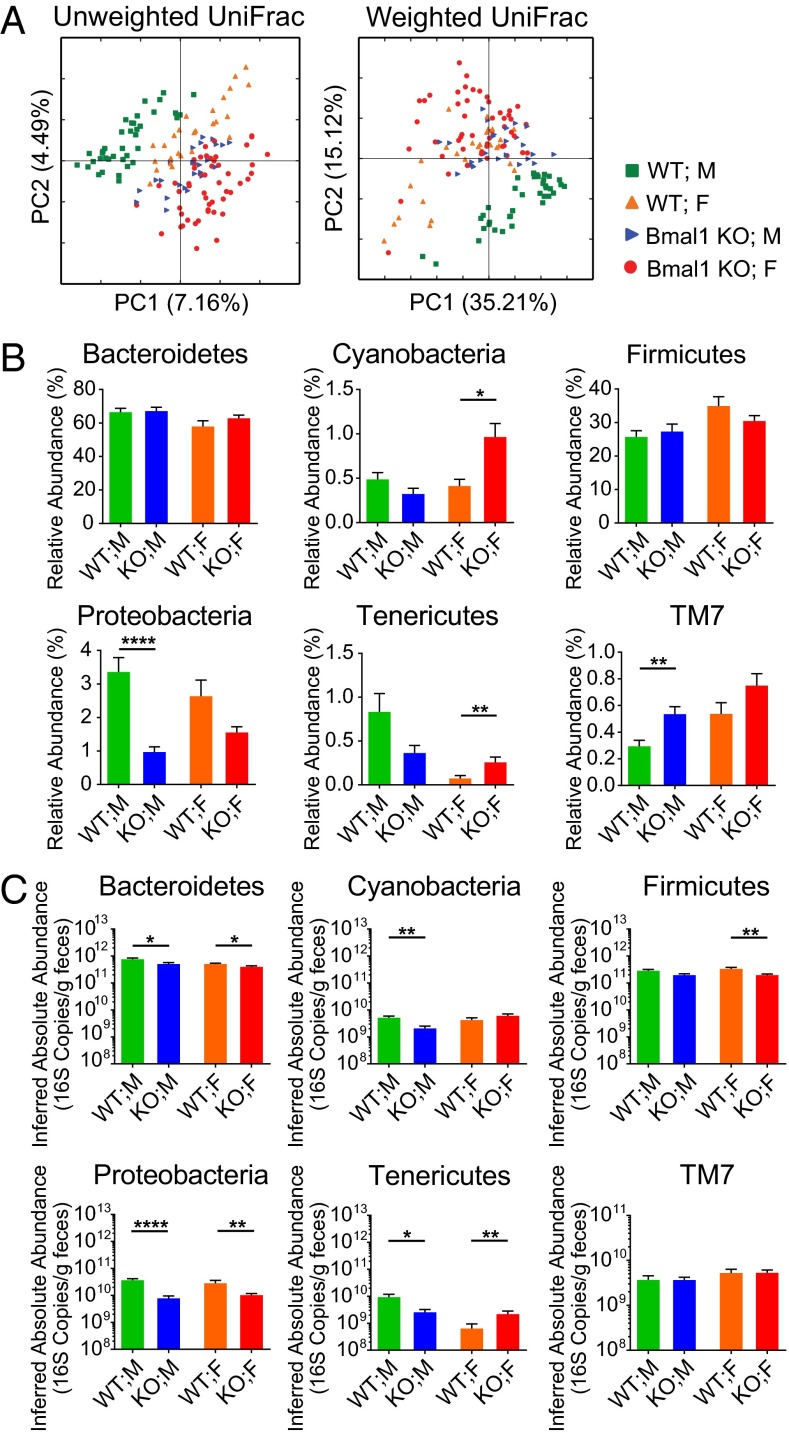
Intestinal microbiota compositions of male and female mice respond differently to Bmal1 deletion. Fecal microbiota profiles from individual mice at all time points across the day were compared based on sex and genotype. (A) Fecal microbiota composition of male WT mice (green), male Bmal1 KO mice (blue), female WT mice (orange), and female Bmal1 KO mice (red) were clustered according to Principal Coordinate Analysis of Unweighted UniFrac (left) and Weighted UniFrac (right) distances. Percentages of variation explained by principal coordinates PC1 and PC2 are indicated on the x and y axes. (B) The relative abundances at phylum level. (C) The inferred absolute abundances at phylum level. NWT = 5, NBmal1 KO = 6. M, male; F, female. *P < 0.05, **P < 0.01, ****P < 0.0001 by Mann–Whitney test. Eleven out of 12 remained significant when adjusted to control for a false positive rate of 5%.

