Fig. 3.
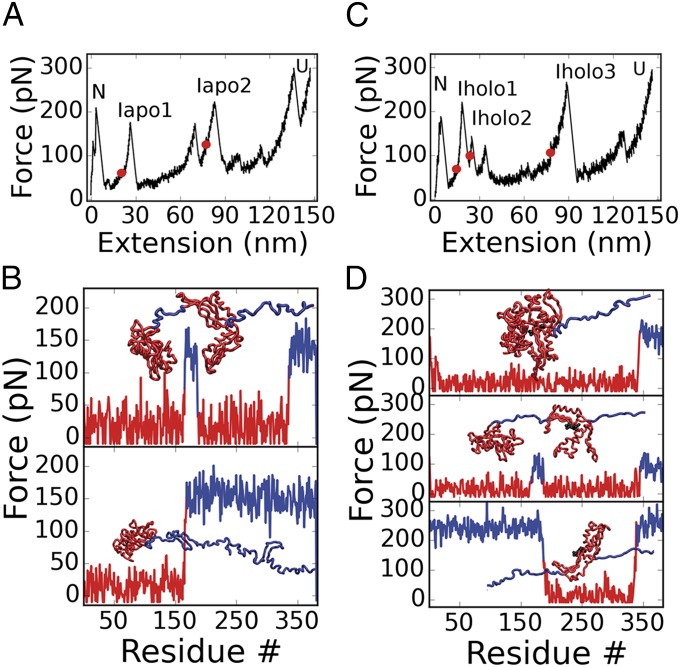
Forced unfolding simulations of the NBD. Simulation results for apo- and holo-NBD. (A) Force extension curve (FEC) for the unfolding of the apo-form. Intermediates Iapo1 and Iapo2 are labeled on the respective force peaks. (B) Tension propagation in the chain and conformational snapshots for the two intermediates evaluated from the red points in A. (Top) For Iapo1, tension is greatest in the connecting loop and in helices 15 and 16 (residues 168–187 and 339–383). The snapshot shows that this corresponds to the separation of the lobes and the unfolding of those helices. (Bottom) For Iapo2, before lobe I unravels, the connecting loop and the entire lobe II experiences increased tension (residues from Iapo1 plus 188–338). (C) FEC for the unfolding of the holo-form. Intermediates Iholo1, Iholo2, and Iholo3 are labeled. (D) Tension propagation in the chain and conformational snapshots for the three intermediates evaluated from the red points in C. (Top) For Iholo1, helices 15 and 16 are extracted from lobe II due to increased tension (residues 346–383). (Middle) For Iholo2, the two lobes separate due to the increased tension in the connecting loop (residues from Iholo1 plus 169–187). (Bottom) In Iholo3, only lobe II remains folded (residues from Iholo2 and positions 1–168 unfold).

