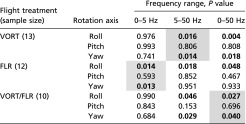
Table S2.
P values from paired t tests to assess differences in body rotation rates between load treatments under the three flight conditions
 |
We applied three different frequency filters to the rotation rates: 0–5 Hz to isolate low-frequency, voluntary casting motions associated with flower tracking; 5–50 Hz to isolate higher-frequency body dynamics associated with flow perturbations; and 0–50 Hz to assess combined effects on both low- and high-frequency body dynamics. In our analysis, we focused on the results highlighted in gray, because these were the most relevant frequency ranges for each flight treatment. Values in bold indicate significance at the 0.05 level; where a significant difference was found, bees always displayed higher rotation rates with the abdominal load.
