
Fig. 2.
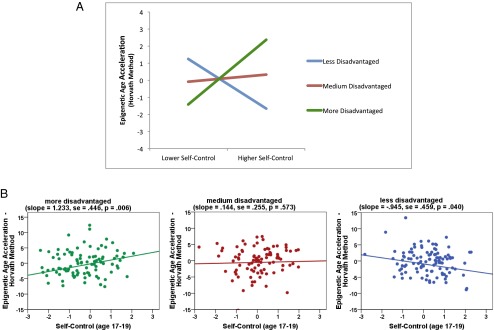
Self-control’s association with epigenetic age acceleration varies according to SES. (A) Depiction of estimated Horvath values at lower (−1.5 SD) and higher (+1.5 SD) levels of self-control and socioeconomic disadvantage. (B) Depiction of individual data points and regression slopes for subjects who are more (≥1.5 SD above sample mean) (Left), medium (-1.49 to +1.49 SD) (Center), and less (less than or equal to −1.5 SD) (Right) disadvantaged relative to the sample distribution.