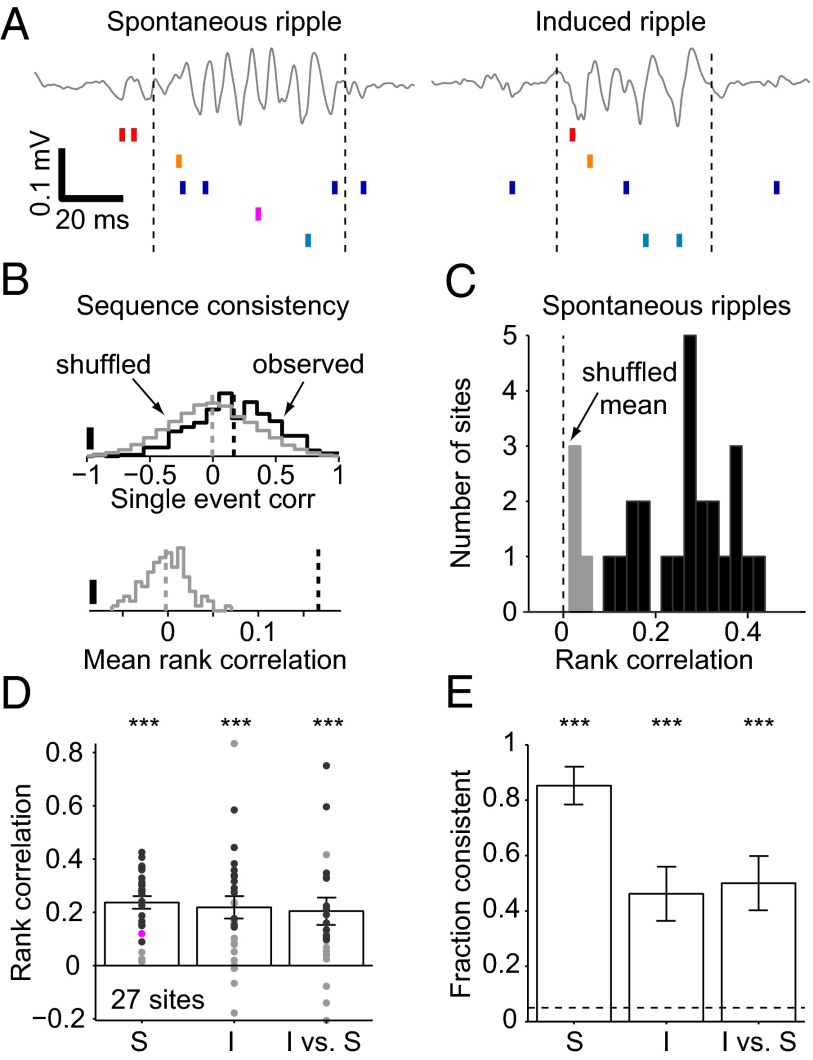
Fig. 4.
Spike sequences are correlated during spontaneous and induced ripples. (A) Example ripples and associated local spiking. Traces are the same as in Fig. 2A, blue traces, filtered 80–250 Hz. Units (red hues, PYR; blue hues, INT) were sorted according to the time of first spike occurrence during the spontaneous ripple. Dashed lines indicate ripple (or light) onset and offset; note similar rank order during the induced event. (B) Permutation test for sequence consistency. (Upper) Distribution of the observed rank correlations for multineuronal spike sequences during 302 spontaneous ripple events (black; same site as in A) and the correlations for randomly permuted (“shuffled”) unit labels (gray; single shuffle; scale bars, 5%). (Lower) Distribution of 1000 shuffled means. The observed mean rank correlation (dashed line), 0.16, is larger than all shuffled means (P < 0.001). (C) Spike sequence consistency during spontaneous ripples (n = 27 sites in 11 sessions; four freely moving CaMKII::ChR2 mice; template method). Black, sites with significant (P < 0.05, permutation test) rank correlation (“consistent” sequences); gray, not significantly consistent. (D) Sequence consistency during spontaneous ripples (S; same data as in C), induced ripples (I), and induced vs. spontaneous ripples. Data are from the same animals as in C. Dots, individual sites; bars, group means (SEM); black dots, sites with consistent sequences; magenta dot, example dataset used in B. ***P < 0.005, Wilcoxon’s signed rank test (zero median null). (E) Fraction of recording sites with consistent sequences. Dashed line shows chance level. Error bars, SEM; ***P < 0.005, exact Binomial test.

