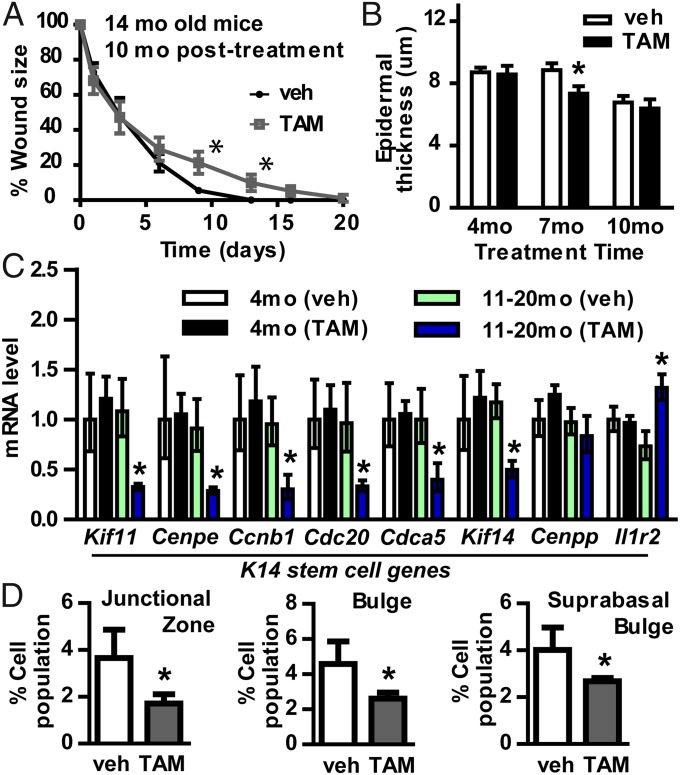
Fig. 3.
Wound closure in old K14S mice. (A) Average wound size (mean ± SEM) after injury by 8-mm punch biopsy in 14-mo-old K14S mice treated with veh or TAM (veh, n = 10; TAM, n = 11) at age 4 mo. Percent wound size refers to the wound area relative to the initial wound area × 100. (B) Quantification of epidermal thickness (in µm) in H&E-stained K14S mouse skin at 4, 7, and 10 mo after veh (Left) or TAM (Right) treatment (n = 5 each). (C) mRNA levels of genes expressed predominantly in K14+ stem cells, analyzed by qPCR, in skin from K14S mice at 4 or 11–20 mo after treatment with veh or TAM. Mean ± SEM values with asterisks indicate differences at P < 0.05 relative to vehicle control by two-way ANOVA, followed by Bonferroni post hoc analysis. (D) Quantification of flow cytometry histographs of epidermal cells stained for CD49f, CD34, and Sca1, isolated from the skin of 14-mo-old K14S mice treated with veh or TAM at age 4 mo (n = 5 for each). Populations of bulge stem cells (CD49fhi/CD34+), suprabasal bulge stem cells (CD49flo/CD34+), and junctional zone stem cells (CD49fhi/CD34−/Sca1−) were quantified as the average percent cell population (mean ± SEM) in the epidermis. Asterisks indicate differences at P < 0.05 by Student’s t test.

