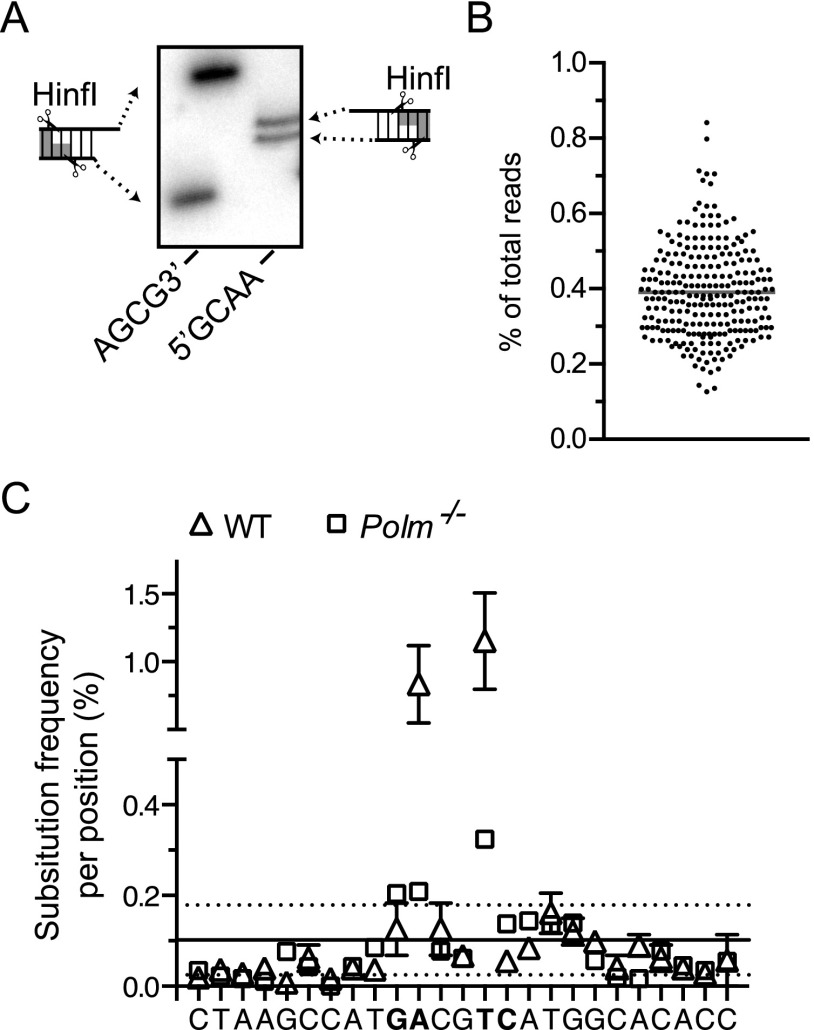
Fig. S7.
Validation of the cellular NHEJ assay. (A) Representative substrates were HinfI digested, 32P-labeled, and resolved by denaturing polyacrylamide gel electrophoresis. (B) A library of a control oligonucleotide with an embedded degenerate tetramer was prepared for sequencing from the same number of input molecules and using an identical workflow as experimental samples. The frequency of reads for each different sequence, from a total of 11,776 reads, is plotted for each of the predicted 256 sequences. (C) Mean frequency of single nucleotide substitutions for joined products of GACG3′ recovered from WT (triangles) and Pol μ-deficient cells (squares) over a portion of the junction flanking the ends. Sites of cellular polymerase-dependent gap filling are bolded. Error frequencies at each position of the experimental samples fall within 1 SD (dashed lines) of the mean substitution error (solid line) derived from sample processing (as determined for a control amplicon generated by T4 ligation of 5′GATC in vitro), except at two positions in which substitution rate is higher and largely attributable to repeated C addition by Pol μ (see also Fig. 3A).

