Significance
There are two broad components of information dynamics in cancer evolution. One involves permanent changes in which genes are subject to gain or loss-of-function substitutions. This is well established and the main focus of cancer research. The other component is the information in the human genome and preservation of that content. The cancer cell potentially has access to all of this and can upregulate or downregulate any number of strategies used for survival and proliferation during embryogenesis, development, and normal adaptation to environmental stresses. We suggest that nonsubstituted genes may be critical targets for chemotherapy; these nonmutated genes may be the most fundamental ones for preservation of cancer cell fitness, especially if their expression level changes.
Keywords: cancer, emergence, ancient genes, cold, hot
Abstract
We use a microfabricated ecology with a doxorubicin gradient and population fragmentation to produce a strong Darwinian selective pressure that drives forward the rapid emergence of doxorubicin resistance in multiple myeloma (MM) cancer cells. RNA sequencing of the resistant cells was used to examine (i) emergence of genes with high de novo substitution densities (i.e., hot genes) and (ii) genes never substituted (i.e., cold genes). The set of cold genes, which were 21% of the genes sequenced, were further winnowed down by examining excess expression levels. Both the most highly substituted genes and the most highly expressed never-substituted genes were biased in age toward the most ancient of genes. This would support the model that cancer represents a revision back to ancient forms of life adapted to high fitness under extreme stress, and suggests that these ancient genes may be targets for cancer therapy.
Multiple myeloma (MM), a hematologic cancer that develops in the bone marrow, is usually incurable because chemotherapy resistance emerges (1). The emergence of resistance may be largely due to the fact that bone marrow represents a very complex environment, due to the spatial heterogeneity of the bone marrow structure and the nonuniform distributions of nutrient, oxygen, and drug (during chemotherapeutic treatment) (2). Recent studies of the bone marrow represent an ideal ecology to be reproduced by microfluidic systems, with designed in vitro complex environments with a functional hematopoietic niche (3). Glucose gradient or chemotherapy gradients have been used to study the phenotypic progression of cancer in complex environments (4, 5); now we add the compartmentalization of small, possibly clonal, communities within the gradient. Just as rapid fixation of drug-resistant bacterial mutants in a metapopulation can occur in an environment with drug gradients and connected microhabitats (6–8), we demonstrate that an ecologically designed microenvironment, with drug gradients and connected microhabitats, can drive the rapid emergence of resistance in MM. We then use transcriptome sequencing of the far more complex (than in bacteria) genomic substitution patterns in the evolved MM cancer cells to address the question: What is the role of both substitutions and nonsubstitutions in the evolved genomes of the resistant cells in driving drug resistance?
In our previous work, we analyzed the 2D motions of metastatic breast cancer cells at the single-cellular level within a drug gradient without any local population bottlenecks (5). These experiments lasted for 72 h (at most, three generations), and there were no microhabitats within drug gradients, nor was any genomic analysis made. Here we designed connected microhabitats (hexagonal arrays) in the cell region to mimic the porous bone marrow structure, creating a metapopulation within the drug gradient with local fixation possibilities and invasion of more-fit mutants into higher-toxicity environments (6), and then analyzed the genomic changes that emerged in such a short time.
A critical part of this paper is the frequency of substitutions and nonsubstitutions in the resistant cells that emerge. Certainly, substitutions play a general role in the evolution of drug resistance and, therefore, targeted therapy could require a mutational event to provide cancer cells with a strategy around the therapy. However, we also know that duplication of key genes is common. This is a well-known evolutionary event that allows asexually reproducing species to maximize their adaptability and overcome Mueller’s ratchet (9). Gene duplication can also be one of the causes of upregulation of proteins. We will examine this aspect in this paper.
Materials and Methods
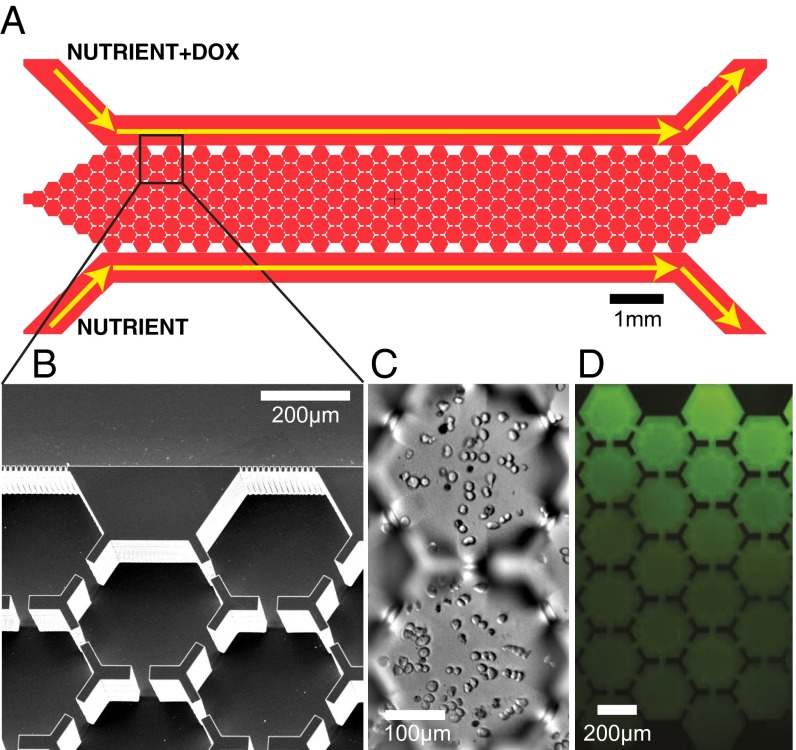
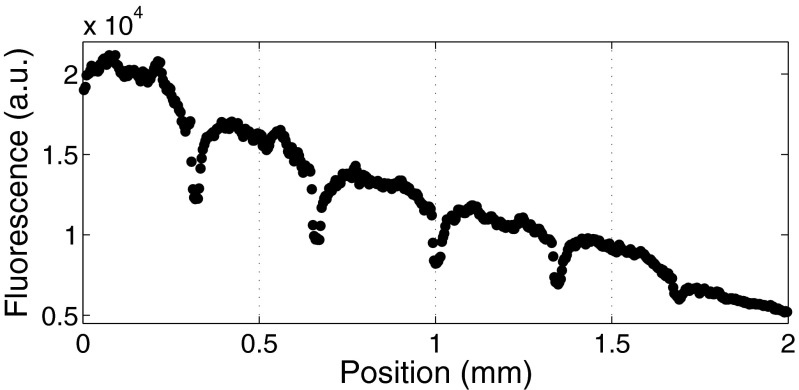
Our device is composed of an array of hexagons, with small passageways connecting the six sides of the hexagons with adjacent ones. The array is a rectangular shape with two parallel channels maintaining the boundary concentrations of drug (Fig. 1). Our protocol was to first inoculate the device with cells without a drug gradient and incubate the cells for 24 h to ensure that the cells were alive and formed a uniform layer (Fig. 1C). Once this was achieved, a drug gradient was put across the culture chamber by turning on two syringes containing growth media alone and growth media containing doxorubicin (Fig. 1D). The gradient became stable within 30 min, and the drug concentration decreased linearly from the high side to the zero side (Fig. S1).
Fig. 1.
Device layout and gradient characterization. (A) An overview of the entire microfluidic device, showing the flow of the nutrient streams and the nutrient + Doxorubicin (Dox) containing streams. The nutrient stream is growth medium, whereas the nutrient + Dox stream is growth medium + 20 nM Dox. (B) Scanning electron microscope image of the area of the array outlined by the box in A. (C) Image of MM cells in the device before imposing Dox gradient. (D) Image of the expected Dox concentration using the dye fluorescein as a marker. Prior work with similar structure to create a gradient (but without the walls to create microhabitats) gives a linear gradient (5).
Fig. S1.
Fluorescent gradient profile across the culture chamber.
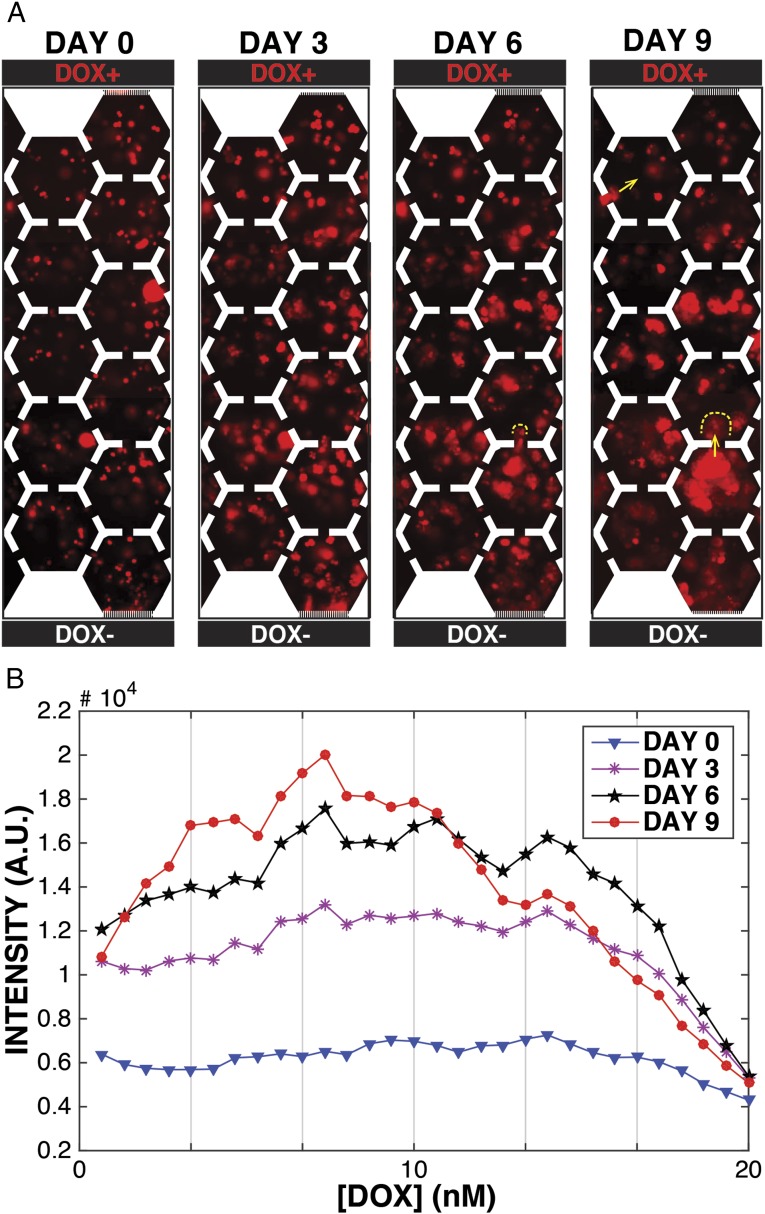
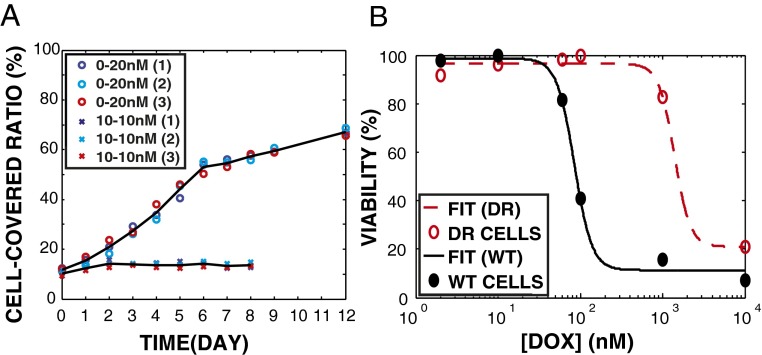
Emergence of doxorubicin resistance occurred on the time scale of days in wild-type parental MM with a high-end doxorubicin concentration of 20 nM [×5 the IC50 under continuous exposure (10)] maintained in the top channel (Dox+ in Fig. 2A). Despite the presence of doxorubicin, MM cells grew well and formed colonies initially near the nutrient channel (Dox− in Fig. 2A). Near the Dox+ channel, initially, MM growth was inhibited for 3 d, but resistant colonies ultimately appeared in a nonuniform manner across the gradient, as seen in Fig. 2B. The total increase in cell coverage during the experiment was only ×4 (from 15% to 60% as shown in Fig. 3A), indicating that, in the absence of cell death, only two generations of cells had passed before significant resistance had emerged. However, the increase in cell density was greatest at the midpoint of the gradient, where the doxorubicin concentration is still ×2 the IC50, indicating the emergence of resistance across the gradient, and cell density proceeded toward the higher doxorubicin concentrations. Note that the overall population density only increases by a factor of ×4 in our 9-d experiments, which indicates that only four cell division cycles have occurred. Thus, the evolution of drug resistance in this experiment is relatively fast in terms of generation cycles.
Fig. 2.
Emergence of doxorubicin resistance of MM cells in a doxorubicin gradient. (A) Images of MM cells (8226/RFP) under a doxorubicin gradient (0−20 nM per 2 mm) in time series. Doxorubicin diffuses from the top to the bottom. Yellow dotted lines denote possible routes for MM cell migration. (B) Averaged density of MM cells (red fluorescence intensity) as a function of time and position in the doxorubicin gradient.
Fig. 3.
Emergence of doxorubicin resistance in a doxorubicin gradient. (A) Growth curves of MM in microfluidic devices with doxorubicin: uniform (10 nM at both sides) vs. gradient (0−20 nM per 2 mm) doxorubicin exposure. Circles, three devices of gradient (0−20 nM per 2 mm) environment; crosses, three devices of uniform (10 nm) environment; lines, mean of three devices. (B) Doxorubicin dose–response (48-h exposure). Cells from drug gradient device (0−20 nM per 2 mm for 14 d, named as DR, red) vs. parental MM cells (WT, black). Data fitting was based on Hill equation (SI Text). The inhibitory concentration for 50% of control population (IC50) of doxorubicin was increased 16-fold.
We performed two control experiments to demonstrate the necessity of a drug gradient for the emergence of resistant MM cells. For experiment 1, we grew cells in three tissue culture flasks with 10 nM of doxorubicin (replenished every 4 d). The choice of 10 nM is approximately driven by (i) ×2 the IC50 for this drug in a well-mixed tube and (ii) is midway in our gradient, where we see maximal growth in our device (see Fig. 2B). After 14 d, all of the cells lost viability based on trypan blue staining, demonstrating that the emergence of drug resistance cannot be achieved by a conventional single step of drug selection (11). For experiment 2, to confirm that the doxorubicin gradient instead of extracellular matrix induced the doxorubicin resistance in MM (12, 13), we pumped 10 nM of doxorubicin at both side channels of our devices, so that the concentration of drug was uniform at 10 nM throughout the microhabitat culture region, and compared the growth curves of MM with that in the same devices with doxorubicin gradient (0−20 nM per 2 mm) (Fig. 3A). The cells neither migrated nor grew after 3 d of uniform doxorubicin exposure in the devices. After 14 d, all cells in the devices (with or without gradients) were collected, and the viability was measured by trypan blue staining. The fact that all cells in the uniform doxorubicin environment lost viability indicates that the rapid emergence of doxorubicin resistance in MM only occurred in a gradient environment.
Approximately 104 MM cells were harvested after 14 d from the device [named as drug-resistant (DR) cells] and grown in a doxorubicin-free environment for 1 wk to expand the population size in the absence of stress. Then, the dose–response was performed to characterize resistance of DR cells versus the wild type (the parental MM cells, WT) (Fig. 3B) (SI Text). We found that the degree of cross-resistance (the IC50 of DR vs. WT) after 48 h of doxorubicin exposure increased 16-fold. This degree of cross-resistance required 10 mo to achieve by conventional protocols using step-wise increases of doxorubicin (10), indicating the more rapid ability of the MM cells to adapt to mutagenic stresses in a complex microenvironment, of profound impact to MM mortality in vivo.
Sampling MM cells from different regions within the drug gradient might unveil the degrees of resistance that emerged along the gradient. Ideally, spatially resolved sequencing along the drug gradient would allow construction of the resistance phylogeny trajectory. At this point, we grouped the cells from the gradient for dose–response characterization (Fig. 3B) and for sequencing analyses, so we have to leave where the resistance evolves along the gradient and the true role of chemotaxis as an open question.
RNA Sequencing Analysis of Resistant Cells
We performed RNA sequencing analysis of WT and DR samples to identify the expressed substitutions, single-nucleotide variants comparing with human reference genome (GRCh37), and differential expression levels of genes after the emergence of resistance. Note that the observed substitutions from sequencing data are the convolution of mutation and selection, although, in many cases of synonymous substitutions, there probably is no selection at work.
We sequenced four samples; two were samples that evolved in the drug gradient (D) and two were grown in the device without any drug (WT). Each sample was composed of 104 cells collected from three microfluidic devices running simultaneously under the same conditions. Although there is certainly a spatial dependence to the evolved genomes in the DR cells, in this preliminary paper, we grouped all of the cells on the gradient together. Table S1 gives the total number of reads, and Table S2 gives the total number of covered bases in two separate sequencing runs. Dataset S1 gives the expression levels of the genes (10,714 genes) that we detected based on the read abundance.
Table S1.
Mapping statistics
| Number of mapped reads | ||
| Sequencing 1 | Sequencing 2 | |
| DR | 50,292,847 | 93,016,838 |
| WT | 62,384,592 | 111,504,450 |
Table S2.
Coverage
| Number of covered bases (1×) | ||
| Sequencing 1 | Sequencing 2 | |
| DR | 337,174,818 | 479,156,993 |
| WT | 422,900,554 | 646,321,913 |
By no means were all of the roughly 20,000 genes in the human reference genome (Genome Reference Consortium GRCh37) successfully sequenced at high enough high exon coverage for single nucleotide variant (SNV) density analysis of the gene. Investigation of the substitution density that occurred in the subset of genes that we were confident in was done by comparison of the substitutions in the transcriptome of initial MM cells (WT) and the evolved resistant cancer MM cells (DR) to the human reference genome (Genome Reference Consortium GRCh37); this yielded the number of substitutions within a given gene in both the WT and the DR cells. With this 80% cut, we were left with 785 genes where we could confidently compute the SNV density for both the incoming WT and the evolved DR cells. Assuming that 3,804 genes is a minimal set of genes to be expressed at a given time (14), we tested SNV in/out density for ∼20% of the expected fraction of expressed genes at any one time. Thus, this work presents only a snapshot of the full genomic changes occurring in the progression of resistance in our device.
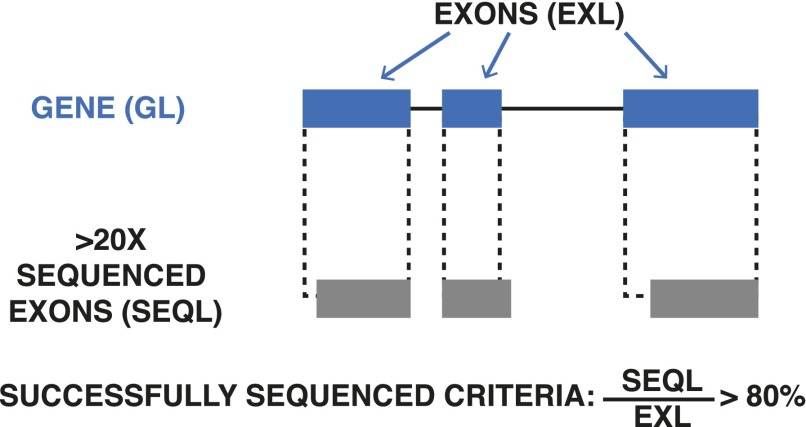
Of the 785 genes where we could do SNV density analysis, we called SNVs that were not present in WT but are found in the evolved cell genome DR de novo substitutions. Fig. S2 summarizes the criteria for successfully sequenced genes. Dataset S2 lists the genomic coordinates of all de novo SNVs in the DR cells.
Fig. S2.
The criteria of successfully sequenced genes for mutation rate analyses: exon regions (bp) have been sequenced with a coverage depth reads.
Only a relatively small fraction (on the order of 20%) of the substitutions were nonsynonymous; the majority were presumably neutral, carried along during evolution as “passenger substitutions.” Table S3 presents the fraction of nonsynonymous substitutions.
Table S3.
Number of SNVs that are detected (nonsynonymous/total)
| Number of nonsynonymous SNVs/total SNVs | ||
| Sequencing 1 | Sequencing 2 | |
| DR | ||
| WT | ||
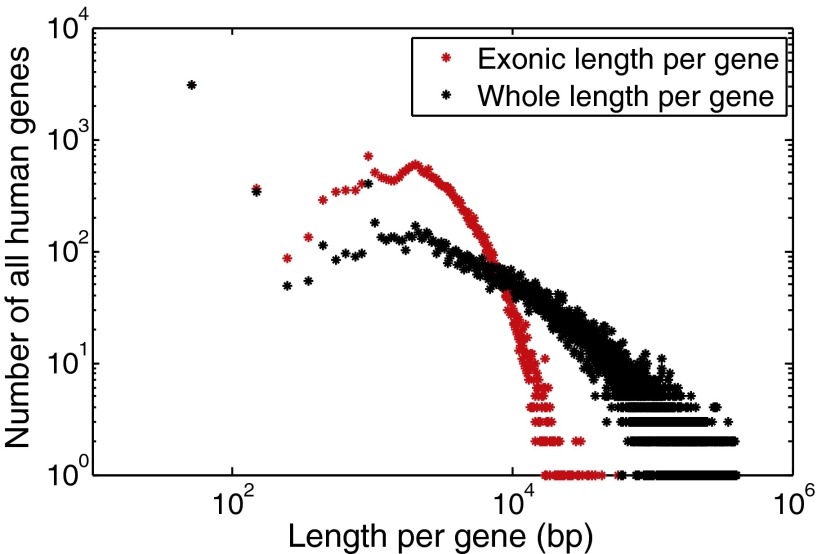
Length matters in calculation of SNV of the density in genes that have genetic substitutions. The absolute number of substitutions in a given gene, that is, the numbers of SNVs per gene, is widely applied as a way to find putative drivers of adaptation (15). However, genes vary tremendously in length, ranging from hundreds to millions of bases in total (intron and exon) length as shown in Fig. S3, a histogram of the number of canonical human genes versus length.
Fig. S3.
Histograms of numbers of canonical human genes vs. lengths; red, exonic length; black, whole gene length.
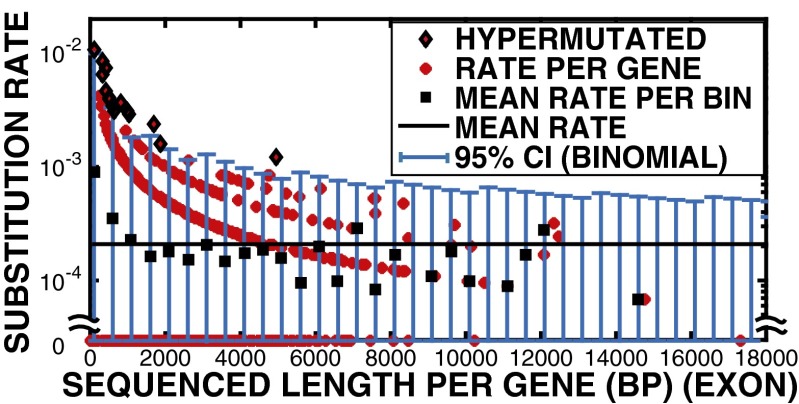
Of course, if substitutions are random, then longer genes will show more substitutions than shorter genes; this does not mean that they are hot spots for substitutions, but rather that they are simply longer. The SNV density should not be a function of length in the random mutation model if there are no hot genes. For each gene(i) we are confident in assigning substitution densities, which we call the “per base substitution density” as the number of de novo substitutions divided by the length in base pairs of the successfully sequenced exon region (covered with 20 reads) . Because, at most, three substitutions were found in a gene, the binary nature of a substation in a given gene yields the nested curves shown in Fig. 4. We thus set the per gene substation density ρ (substitutions/bp) by dividing by the length L of the gene to correct for the smaller target size of short genes. Likewise, if we saw two substitutions, then the rate is 2/L, etc. Fig. 4 shows a nested set, because the substitution rates are quantized at the gene scale, and a set of ascending curves as one approaches the origin (because of the effect by pure chance alone). However, note that as L decreases, one has many more genes. Averaging over the number of genes in a given window size, in our case 500 bp as shown in Fig. 4, gives a better representation of the density of substitution versus length. This process flattens the nested curves into a single curve, but there is still a tendency for more substitutions to occur in short genes compared with long genes.
Fig. 4.
Observed per base de novo substitution rate per gene vs. sequenced exonic length (bp) per gene. Red diamonds, genes that were successfully sequenced for more than 80% of exon region; black square, mean substitution density within a 500-bp window; black line, mean substitution density 2.0 10−4/bp; blue error bars, 95% CI determined by binomial distribution (SI Text); black diamonds with red center, calls for hypermutated genes.
The mean substitution density is low enough that, even in the DR cells, most genes do not have substitutions, and hence presumably the substitutions per gene are governed by Poisson statistics (16). The power of the test is commonly set as 80% (17). Therefore, we followed the flowchart shown in Fig. S4 to determine successfully sequenced genes.
Fig. S4.
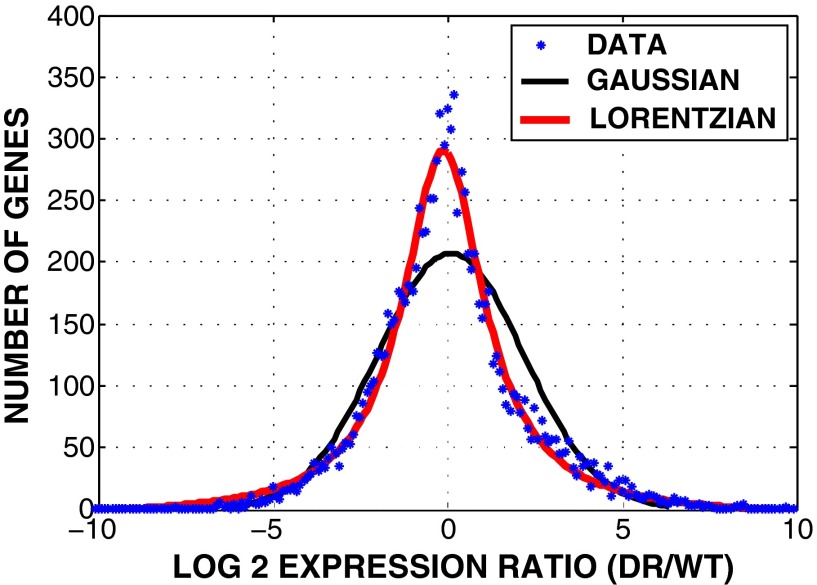
Histograms of numbers of genes vs. log 2 ratio of DR to WT expression levels. The x axis is the log2 ratio of DR expression abundance (FPKM) to WT expression abundance (FPKM); blue, all sequenced genes with expression levels 0.1 in both WT and DR samples were taken into account (Dataset S1); black, Gaussian fit; red, Lorentzian fit.
Margins of error in the per base substitution density on a given gene were determined by calculating the probability of the measured substitution density given the mean substitution density, assuming a binomial error distribution (SI Text). Genes with rates of substitutions, using the Bonferroni method (18), that were outside 95% confidence intervals (CI) from we call hypermutated genes. Of the 785 successfully sequenced genes, 251 genes had at least one de novo SNV, and 163 genes were never mutated in DR nor WT samples, which we called cold genes. Cold genes represented 21% of the successfully sequenced genes, a sizable fraction.
Hot and Cold Genes
We call the genes with more than expected de novo nonsynonymous substitutions hot genes, and ignored synonymous replacements or nonsense replacements. We found 2,617 de novo SNVs, including 446 missense substitutions and 56 nonsense substitutions. In total, 439 genes had at least one de novo nonsynonymous SNVs. Among these genes, 45 genes were successfully sequenced ( for exon region).
We used the standard test for each successfully sequenced gene with de novo nonsynonymous SNV. Given a uniform probability for each position in a gene, a one-tailed binomial test was used to assess whether the observed substitution rate was significantly higher or lower than the binomial distribution. The mean substitution rate was calculated by the number of nonsynonymous SNVs divided by the total number of successfully sequenced bases (). For each gene, the probability of detecting more substitutions than observed (P value) was calculated by the extreme upper tail binomial cumulative distribution function in Matlab.
Then, we performed multiple hypotheses tests using the standard Bonferroni procedure to look for significantly hypermutated genes. Given P values for 45 genes () to be tested at significance level , we rejected null hypothesis (that the gene has expected number of substitutions) if . These significantly hypermutated genes are shown in Table 1.
Table 1.
Hot genes (nonsynonymous only)
| Gene | SNVs | Exon bases | Sequenced exon bases ( 20×) | Substitution rate | Probability* | Age (× y) |
| HIST1H2:00 AM | 2 | 487 | 430 | unknown | ||
| SEH1L | 2 | 3,506 | 2,922 | 1,530.3 | ||
| CCAR1† | 2 | 3,931 | 3,505 | 1,369.0 | ||
| TUBA1A‡ | 1 | 978 | 978 | 2,269.5 | ||
| ATAD2 | 2 | 6,017 | 4,892 | 3,556.3 | ||
| MDH2§ | 1 | 1,305 | 1,207 | 2,535.8 | ||
| TOP2B¶ | 2 | 5,422 | 5,197 | 3,556.3 |
Probability to detect more substitutions than observed for this gene (P value).
Biological process: apoptotic process, cell cycle.
Biological process: protein folding, microtubule-based process, cell division.
Biological process: glucose metabolic process, oxidation−reduction process.
Biological process: DNA topological change, mitotic DNA integrity checkpoint.
These hot genes are involved in various biological functions such as apoptotic process, cell cycle, protein folding, cell division, metabolic process, oxidation−reduction process, and DNA topological change. Because the mechanism of action of doxorubicin includes topoisomerase II inhibition, DNA intercalation, and free radical generation, the abnormally high nonsynonymous substitution rates in these hot genes such as type 2 topoisomerase (TOP2B) may play a crucial role in elevated doxorubicin resistance in experiment.
In the subset of never-mutated (cold) genes, we restricted analysis to genes that had exceptionally high and low expression levels relative to the input WT cells, under the assumption that, among the large number of never-substituted genes, those with large changes in expression levels are playing a role in increase in the fitness of the resistant cells that emerged from our experiment. Because we did not do DNA sequencing, it was impossible to determine if expression-level changes relative to the input WT cells are due to copy number variations and/or changes in transcription factors. The relative expression levels of genes in DR vs. WT samples were based on the abundance of RNA reads (fragments per kilomegabases, FPKM) mapped to genes, as shown in Dataset S1 (SI Text). The log 2 ratio of DR to WT expression levels, , describes how much the expression levels changed after exposure to doxorubicin gradient. In other words, the greater (or less) the log 2 ratio for a given gene, the more it is upregulated (or downregulated) in DR samples. Histograms of numbers of all sequenced genes (with FPKM 0.1 in both WT and DR samples) vs. log 2 ratio of expression levels are shown in Fig. S4.
The cold genes with extreme changes in expression levels seem to code for essential cellular functions, as shown in Tables 2 and 3. Upregulated PRDX4 is associated with spermatogenesis and oxidation−reduction process; upregulated PGK1 is associated with glycolysis and phosphorylation; downregulated PSMC1 is associated with cell cycle, DNA damage response, and apoptosis; downregulated ASB3 is associated with protein ubiquitination; downregulated RPS5 and RPLP0 are associated with translation. Although these zero-substitution genes shared by DR and WT cells do not directly explain drug resistance in DR samples, they could provide insights on protected regions of the genome during malignancy transformation.
Table 2.
Zero substitution, 4× upregulated genes, ages
| Gene | Exon bases | exon bases ( 20×) | age (× y) | |
| PRDX4* | 921 | 801 | 3,556.3 | 5.9 |
| PGK1† | 2,733 | 2,273 | 3,556.3 | 2.0 |
| NOB1‡ | 1,775 | 1,535 | 2,269.5 | 5.9 |
| CKS1B§ | 1,015 | 816 | 2,269.5 | 4.4 |
Spermatogenesis, oxidation−reduction process.
Gluconeogenesis, glycolysis, phosphorylation.
Proteosome biogenesis.
Regulates MM growth.
Table 3.
Zero substitution, 4× downregulated genes, ages
| Gene | Exon bases | exon bases ( 20×) | age ( y) | |
| PSMC1* | 1,595 | 1,531 | 3,556.3 | |
| ASB3† | 1,275 | 1,094 | 3,556.3 | |
| RPS5‡ | 741 | 728 | 3,556.3 | |
| RPLP0§ | 1,304 | 1,124 | 3,556.3 |
Mitotic cell cycle, DNA damage response, apoptotic process.
Protein ubiquitination, intracellular signal transduction.
Ribosomal protein component of 40S subunit.
Ribosomal protein interacts with mitotic checkpoint protein MAD2B.
The cold genes with large expression level changes are presumably important genes that cannot be substituted easily because they play a key role in fitness of the cells. It has been suggested that these cold genes might actually be very ancient genes representing a core functionality that cancer uses to maintain a basic fitness under high-stress conditions, as, presumably, early lifeforms must have experienced (19, 20).
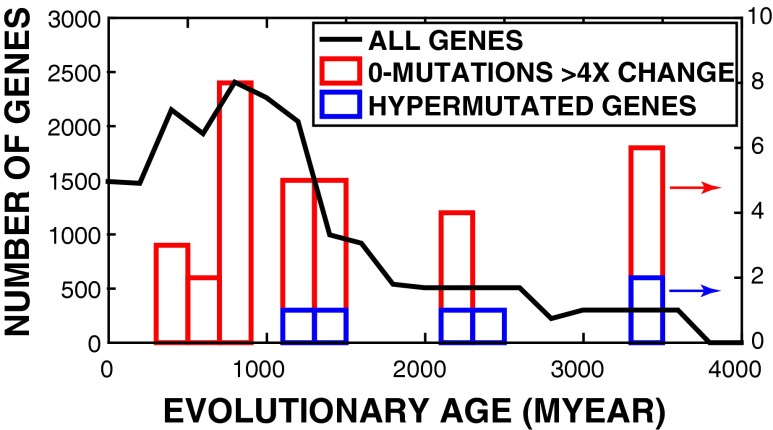
It is possible to estimate roughly the age of genes by assessing the relative positions of the gene homologs in a phylogenetic tree. Such an analysis is shown in Fig. 5. We show there the histogram of calculated gene ages versus the human genome containing over 19,000 genes (solid black line) and the histogram of cold genes from our experiment. We found that the cold, zero-mutation genes we detected are older, on average, then all human genes, with the average age of 1.7 1.0 billion years, compared with 19,786 human genes with an average age of 1.3 0.9 billion years. The error bars, quite large, are simply a measure of the widths of the distributions and not a measure of the errors associated with this analysis, which are difficult to quantify at this stage. However, the large outliers of zero-mutation genes at 3.5 billion years of age are significant.
Fig. 5.
Black is histogram of all human genes with age information (19786 in total). Blue is histogram of never-substituted genes with 4× expression level changes (cold genes) vs. age. Red is histogram of hypersubstituted genes (nonsynonymous only, hot genes) vs. age.
Discussion
We observed that, in a chemotherapy gradient landscape, resistance of MM cells to doxorubicin can emerge rapidly, as we expected from our bacterial work on antibiotic resistance emergence (8). We show that cold genes are more protected than many evolutionary conserved genes (21). We found that genes associated with nucleosome assembly and protein folding tend to mutate rapidly, whereas ancient genes associated with spermatogenesis, oxidation−reduction, and glycolysis are possibly protected and abnormally upregulated as a consequence of acquired drug resistance. The trade-offs may be associated with energy and time limitation in a harsh environment (22) and may be a strategy of cancer cells to evolve rapidly.
Because larger proteins have more surface area and more connections, it has been suggested that they encode more essential cellular functions than smaller proteins across various species (23). Also, ancient genes have been shown to evolve more slowly, and hence are cold, and express more “core” functional proteins compared with young genes (24, 25). As shown in Fig. 5, we observed the selection for the abnormally regulated ancient genes with slow evolution rate in emerged resistant cancer. Our sequencing results for emergence of resistant cancer address the integration on gene length, evolutionary rates, functional essentiality, and evolutionary ages; these properties have occurred in other species for guiding the animal body plans (25).
To be clear, we think there are two broad components of information dynamics in cancer evolution. One involves permanent changes in which genes are subject to gain or loss-of-function substitutions. This is well established and, unfortunately, the main focus of cancer research. The other component is the information in the human genome that is not mutated and in fact is protected from mutations. The cancer cell potentially has access to all of this and can upregulate or downregulate any number of strategies used for survival and proliferation during embryogenesis, development, and normal adaptation to environmental stresses. The concept that a mutation is needed to confer resistance is built into the Norton−Simon model, which has dictated cancer therapy practice for 5 decades (26).
The conventional view of the well-known emergence of drug resistance in cancer is that the initial stages are driven by substitutions that are random and independent events (27). In the conventional view, once a set of substitutions occur, selective pressure (i.e., chemotherapy for cancer) from the environment selects advantageous mutants out of this ensemble of substitutions, with a background of neutral fitness passenger substitutions carried along with the driver substitutions that change fitness (28). In the case of cancer cells under mutagenic stress, substitutions are perhaps random, but the frequency of the substitutions is increased by the stress-induced mutagenesis, so that drugs used in chemotherapy perversely can play a crucial role in the acceleration of the evolution of drug resistance (29). Here we chose the mutagenic chemotherapy drug doxorubicin as a mutagen, used a strong spatial selective pressure created by chemotherapy gradients, and used rapid fixation of substitutions within a metapopulation to accelerate the evolution of drug resistance in cancer, unlike the conventional protocol of gradually increasing in time the drug concentration (temporal drug gradients (11). Clearly, time-dependent chemotherapy gradients are also important in an in vivo setting, but that is beyond the scope of this paper.
An important question that we cannot answer here is: Were the de novo substitutions generated spontaneously or induced by stress? It is experimentally challenging to prove the existence of stress-induced mutagenesis, via upregulation of error-prone DNA polymerases or repressing DNA repair enzymes, because de novo mutation and selection usually come together (29). However, we observed upregulation of polymerase delta-interacting protein (POLDIP2) of DR cells in our experiments. POLDIP2 is known to support DNA polymerase λ in translesion synthesis, which often has low fidelity (high propensity to insert wrong bases) on undamaged templates relative to regular polymerases and may induce de novo substitutions (29, 30). This error-prone recovery also protects DR cells from oxidative damage caused by doxorubicin (31, 32).
Another question is the role that cancer plays in development (25) and the transition from unicellular to multicellular behavior, and the role that cancer has played as an evolutionary variable (33). Because we show that up-expressed nonsubstituted genes and highly substituted genes are predominantly ancient genes, perhaps cancer represents a return to unicellularity that is represented by these crucial and ancient genes, with cancer allowing substitutions in, or abandoning higher-level genes associated with, multicellular cooperation (34). Clearly, with our limited data set, in this paper, we cannot address this question in a deeply quantitative way, but we hope we can point to different ways of viewing how cancer has influenced the process of development and its possible ancient origins.
SI Text
SI Materials and Methods
Device Design and Fabrication.
Our device was composed of a culture chamber between two parallel channels etched 15 μm deep into silicon wafer using rapid ionic etcher (Samco 800). The culture chamber was occupied by 220 hexagonal wells (microhabitats) with sides 180 μm long, weakly connected to each other via microchannels that were 40 μm long and wide (Fig. S1 A and B). The supplying channels and the culture chamber were separated by microposts with gaps of 2.5 μm to allow diffusion of nutrients and drug into the interior of the culture chamber (Fig. S1B).
Cell Culture and Chemotherapeutic Reagent.
The red fluorescent protein (RFP)-labeled myeloma cell line (RPMI-8226) is courtesy of Robert Gatenby Lab from Moffitt Cancer Center. MM cells (8226/RFP) were mixed with 33% (vol/vol) matrigel and dropped on the culture chamber coated by fibronectin (6 μg/μm2), then sealed by polydimethylsiloxane (PDMS)-coated glass slide. The device loaded with cells was placed in a standard incubator with 5% (vol/vol) CO2 and 37 °C overnight before the drug gradient was turned on (Fig. S1C). Doxorubicin, a chemotherapeutic agent that stabilizes the topoisomerase-II-DNA complex to inhibit DNA replication and cell division (30), was used as the stressor across the culture chamber. Stable gradient was established by continuously pumping growth medium [RPMI 1640 with 10% (vol/vol) FBS] containing doxorubicin at the top channel (Dox+) and growth medium alone at the bottom channel (nutrient channel, Dox−) at a rate of 30 μl/h.
Imaging.
A Nikon upright microscope and Qimaging charge-coupled device camera were used to obtain images of bright field and red fluorescent channels.
Migration and Division Rates.
By tracking the trajectories of MM cells in the device without a drug gradient, we can measure the diffusion coefficient of the myeloma cells based on the slope of mean square displacement vs. time (T). The diffusion coefficient of MM cells we measured () is 3 μm2/min. Although there is also a chemotactic component of cell migration within a gradient, at this point, it is too complex to measure. Therefore, we estimate that the cells migrate up to 209 μm in 10 d ().
To consider how fast a resistant colony would expand in 10 d, we should consider the physical size of a cell (a radius of 5 μm) and the division rate of a resistant cell (at most once per day, λ). If we assume the colony is a spheroid, the number of cells (N) in a spheroid is , where R is the spheroid radius (micrometers) and ρ is number density (1/cell volume = 0.002 μm−3). We assume the colony follows exponential growth with an initial population and a division rate of λ, . Then . If we assume (cell), (per day), (days), then . Thus, the colony formed by a resistant cell would expand with a radius of 50 μm in 10 d. Based on the estimation, individual MM cell may migrate faster than its colony expansion.
Cell Collection from the Device and Characterization of the Dose–Response.
After applying drug gradient to the cells for 2 wk, the PDMS lid on the device was removed using a razor blade. Then the cells in the device were pipetted and transferred to a Petri dish with growth medium at 37 °C. After expanding the population at drug-free medium, a Cell Proliferation kit (XTT) from Roche was used to characterize doxorubicin dose–response of cells to determine its inhibition concentration of 50% of controlled population (IC50). Dose–response curves were fitted by using Hill equation, , where V is viability (percent), E is drug effect, C is drug concentration, and ε is constant (35).
Statistical Analyses of Significantly Mutated Genes.
There are many methods to calculate background mutation density (BMD) and identify significantly mutated genes (16). In this work, we adopted one of the simplest methods, assuming that the results are not very sensitive to which methods were chosen (36). We performed statistical tests on the observed mutations across samples to identify genes that harbor mutations under selection during emergence of drug resistance. We first estimate a BMD, based on total de novo mutations, and then identify genes mutated beyond this density. Because we worked with RNA sequencing with Poly-A enrichment, we preferentially selected the mature RNA to sequence. Therefore, we only calculated the BMD using mutations and coverage at the exome. In at least one sample, we successfully sequenced (depth 20 reads) 13,714,589 bases at the exome. We detected 2,617 de novo mutations at the exome, giving a BMD of . Fig. S2 gives a graphic of these criteria.
Assuming a uniform probability for each position in a gene, a one-tailed binomial test was used to assess whether the observed mutation density was significantly higher or lower than the binomial distribution expected in a random process. Then, we performed multiple hypotheses tests (one per gene) using the standard Benjamini–Hochberg procedure to look for significantly hypermutated genes. Among N genes with more than sequenced exons, the probability of detecting more than observed SNVs for each gene with a × sequenced exon length (SEQL) and number of SNVs in exons (x) is .
This probability is also known as the P value. Based on the Benjamini–Hochberg procedure, we first ranked the P values of N genes with more than sequenced exons. Then the significant hypermutated genes that are the first to kth genes can be determined by , where . In our results, we found that .
We address the relative expression levels of genes in DR vs. WT samples based on the abundance of RNA reads (FPKM) mapped to genes, as shown in Dataset S1. The log 2 ratio of DR to WT expression levels, , describes how much the expression levels changed after exposure to doxorubicin gradient. In other words, the greater (or less) the log 2 ratio for a given gene, the greater likelihood that it is upregulated (or downregulated) in DR samples. Histograms of numbers of all sequenced genes (with FPKM 0.1 in both WT and DR samples) vs. log 2 ratio of expression levels are shown in Fig. S4.
A common mistake is to assume that a normal distribution of differential expressions would also yield simple Gaussian (normal) statistics. However, it has been pointed out by Brody et al. (37) that a distribution of the ratio x/y of two normally distributed random variables is not a Gaussian but rather a Lorentzian. The histogram shown in Fig. S4 of copy number variations does indeed fit a Lorentzian distribution much better than a Gaussian distribution. This implies that what appear to be outliers in the distribution are not, in fact, outliers but artifacts of the analysis, making comments about particular genes difficult. The mean of the distribution is, however, statistically significant. Because there is a shift of the mean of the Lorentzian curve to the left of the origin (Fig. S4), this may be a result of DR cancer cells suppressing some normal cell functions, but it is difficult to proceed further.
Transcriptome Sequencing.
We collected about 10,000 cells from each DR sample for transcriptome sequencing. RNA extraction was performed using Absolutely RNA Nanoprep Kit (Agilent), and the RNA concentration was determined on the Agilent 2100 Bioanalyzer (Agilent). Poly-A-enrichment of mRNA and cDNA library construction were performed by Nader Pourmand at University of California, Santa Cruz. The RNA samples were sequenced using the Illumina HiSeq platform, yielding 27–111 million 100-bp paired-end high-quality reads per sample.
Mapping, SNVs, and Expression Analyses.
FastQC was used to perform quality control of the reads. The majority of reads from each sample (50–75%) were uniquely aligned against human reference genome build GRCh37 (hg19) using TopHat (38). The Genome Analysis Toolkit (39) was used to identify SNVs. We filtered the SNVs with coverage depth more than 20 reads, base quality greater than 20, and P value smaller than 0.01. Because we collected about 10,000 cells from each DR sample for sequencing, not all substitutions may be present in every cell. To analyze mutated genes, we annotated them using Oncotator (www.broadinstitute.org/oncotator/). We used bedtools to find covered bases per gene. The transcript abundances (FPKM) were compared between DR and WT cells to assess differential expression levels using Cufflinks (40).
Ages of Genes.
Ages of 19,786 human genes were a courtesy from Paul Davies’ laboratory at Arizona State University based on the relative positions of the genes’ homologs in a phylogenetic tree.
Gaussian and Lorentzian Fit.
We performed the fitting of the expression ratio histogram by using “histfit” function and “lorentzfit” function in Matlab.
The 95% CI of Per Base Substitution Rate.
Mean mutation rate (μ) is calculated by total number of exonic SNVs divided by total number of successfully sequenced exonic bases. Here, x is number of exonic SNVs for a given gene. To determine the 95% CI of per base mutation rate, we need to know, for a given exonic length, the probability of detecting more then (or less than ) substitutions would be less than 5%. Based on binomial distribution, for a given exonic length of a gene (L), the probability of detecting “more” than SNVs is . For a given exonic length of a gene (L), the probability of detecting “less” than SNVs is . We looked for minimal integers and maximal integers such that and for a given exonic length. Then, the upper bound of 95% CI would be , and the lower bound of 95% CI would be . Because and are integers, kinks are observed in 95% CI.
Supplementary Material
Acknowledgments
We thank our referees for provocative questions that greatly improved the paper, and Charles Lineweaver for discussions. The project described was supported by National Cancer Institute Grants U54CA143803 and U54CA143862.
Footnotes
The authors declare no conflict of interest.
2Deceased June 5, 2015.
This article contains supporting information online at www.pnas.org/lookup/suppl/doi:10.1073/pnas.1512396112/-/DCSupplemental.
References
- 1.Mahindra A, et al. Latest advances and current challenges in the treatment of multiple myeloma. Nat Rev Clin Oncol. 2012;9(3):135–143. doi: 10.1038/nrclinonc.2012.15. [DOI] [PubMed] [Google Scholar]
- 2.Mercier FE, Ragu C, Scadden DT. The bone marrow at the crossroads of blood and immunity. Nat Rev Immunol. 2012;12(1):49–60. doi: 10.1038/nri3132. [DOI] [PMC free article] [PubMed] [Google Scholar]
- 3.Torisawa YS, et al. Bone marrow-on-a-chip replicates hematopoietic niche physiology in vitro. Nat Methods. 2014;11(6):663–669. doi: 10.1038/nmeth.2938. [DOI] [PubMed] [Google Scholar]
- 4.Liu L, et al. Minimization of thermodynamic costs in cancer cell invasion. Proc Natl Acad Sci USA. 2013;110(5):1686–1691. doi: 10.1073/pnas.1221147110. [DOI] [PMC free article] [PubMed] [Google Scholar]
- 5.Wu A, et al. Cell motility and drug gradients in the emergence of resistance to chemotherapy. Proc Natl Acad Sci USA. 2013;110(40):16103–16108. doi: 10.1073/pnas.1314385110. [DOI] [PMC free article] [PubMed] [Google Scholar]
- 6.Wright S. 1932. The roles of mutation, inbreeding, crossbreeding and selection in evolution. Proc Int Congr Genet 6:356–366.
- 7.Hermsen R, Hwa T. Sources and sinks: A stochastic model of evolution in heterogeneous environments. Phys Rev Lett. 2010;105(24):248104. doi: 10.1103/PhysRevLett.105.248104. [DOI] [PMC free article] [PubMed] [Google Scholar]
- 8.Zhang Q, et al. Acceleration of emergence of bacterial antibiotic resistance in connected microenvironments. Science. 2011;333(6050):1764–1767. doi: 10.1126/science.1208747. [DOI] [PubMed] [Google Scholar]
- 9.Muller HJ. Some genetic aspects of sex. Am Nat. 1932;66(703):118–138. [Google Scholar]
- 10.Dalton WS, Durie BG, Alberts DS, Gerlach JH, Cress AE. Characterization of a new drug-resistant human myeloma cell line that expresses P-glycoprotein. Cancer Res. 1986;46(10):5125–5130. [PubMed] [Google Scholar]
- 11.Calcagno AM, Ambudkar SV. 2010. Multi-Drug Resistance in Cancer, Methods in Molecular Biology, ed Zhou J (Humana Press, Totowa, NJ), Vol 596, pp 77–93.
- 12.Damiano JS, Cress AE, Hazlehurst LA, Shtil AA, Dalton WS. Cell adhesion mediated drug resistance (CAM-DR): Role of integrins and resistance to apoptosis in human myeloma cell lines. Blood. 1999;93(5):1658–1667. [PMC free article] [PubMed] [Google Scholar]
- 13.Meads MB, Gatenby RA, Dalton WS. Environment-mediated drug resistance: A major contributor to minimal residual disease. Nat Rev Cancer. 2009;9(9):665–674. doi: 10.1038/nrc2714. [DOI] [PubMed] [Google Scholar]
- 14.Eisenberg E, Levanon EY. Human housekeeping genes, revisited. Trends Genet. 2013;29(10):569–574. doi: 10.1016/j.tig.2013.05.010. [DOI] [PubMed] [Google Scholar]
- 15.Lang GI, et al. Pervasive genetic hitchhiking and clonal interference in forty evolving yeast populations. Nature. 2013;500(7464):571–574. doi: 10.1038/nature12344. [DOI] [PMC free article] [PubMed] [Google Scholar]
- 16.Chapman MA, et al. Initial genome sequencing and analysis of multiple myeloma. Nature. 2011;471(7339):467–472. doi: 10.1038/nature09837. [DOI] [PMC free article] [PubMed] [Google Scholar]
- 17.Colquhoun D. An investigation of the false discovery rate and the misinterpretation of p-values. R Soc Open Sci. 2014;1(3):140216. doi: 10.1098/rsos.140216. [DOI] [PMC free article] [PubMed] [Google Scholar]
- 18.Shaffer JP. Multiple Hypothesis Testing. Annu Rev Psychol. 1995;46:561–584. [Google Scholar]
- 19.Davies PCW, Lineweaver CH. Cancer tumors as Metazoa 1.0: Tapping genes of ancient ancestors. Phys Biol. 2011;8(1):015001. doi: 10.1088/1478-3975/8/1/015001. [DOI] [PMC free article] [PubMed] [Google Scholar]
- 20.Davies P. Exposing cancer’s deep evolutionary roots. Phys World. 2013;26(7):37–40. [Google Scholar]
- 21.Bejerano G, et al. Ultraconserved elements in the human genome. Science. 2004;304(5675):1321–1325. doi: 10.1126/science.1098119. [DOI] [PubMed] [Google Scholar]
- 22.Aktipis CA, Boddy AM, Gatenby RA, Brown JS, Maley CC. Life history trade-offs in cancer evolution. Nat Rev Cancer. 2013;13(12):883–892. doi: 10.1038/nrc3606. [DOI] [PMC free article] [PubMed] [Google Scholar]
- 23.Tan T, Frenkel D, Gupta V, Deem MW. 2005. Length, protein−protein interactions, and complexity. Physica A 350(1):52–62.
- 24.He J, Sun J, Deem MW. Spontaneous emergence of modularity in a model of evolving individuals and in real networks. Phys Rev E Stat Nonlin Soft Matter Phys. 2009;79(3 Pt 1):031907. doi: 10.1103/PhysRevE.79.031907. [DOI] [PubMed] [Google Scholar]
- 25.He J, Deem MW. Hierarchical evolution of animal body plans. Dev Biol. 2010;337(1):157–161. doi: 10.1016/j.ydbio.2009.09.038. [DOI] [PubMed] [Google Scholar]
- 26.Simon R, Norton L. The Norton-Simon hypothesis: Designing more effective and less toxic chemotherapeutic regimens. Nat Clin Pract Oncol. 2006;3(8):406–407. doi: 10.1038/ncponc0560. [DOI] [PubMed] [Google Scholar]
- 27.Lawrence MS, et al. Mutational heterogeneity in cancer and the search for new cancer-associated genes. Nature. 2013;499(7457):214–218. doi: 10.1038/nature12213. [DOI] [PMC free article] [PubMed] [Google Scholar]
- 28.Bozic I, et al. Accumulation of driver and passenger mutations during tumor progression. Proc Natl Acad Sci USA. 2010;107(43):18545–18550. doi: 10.1073/pnas.1010978107. [DOI] [PMC free article] [PubMed] [Google Scholar]
- 29.MacLean RC, Torres-Barceló C, Moxon R. Evaluating evolutionary models of stress-induced mutagenesis in bacteria. Nat Rev Genet. 2013;14(3):221–227. doi: 10.1038/nrg3415. [DOI] [PubMed] [Google Scholar]
- 30.Hurley LH. DNA and its associated processes as targets for cancer therapy. Nat Rev Cancer. 2002;2(3):188–200. doi: 10.1038/nrc749. [DOI] [PubMed] [Google Scholar]
- 31.Minotti G, Menna P, Salvatorelli E, Cairo G, Gianni L. Anthracyclines: Molecular advances and pharmacologic developments in antitumor activity and cardiotoxicity. Pharmacol Rev. 2004;56(2):185–229. doi: 10.1124/pr.56.2.6. [DOI] [PubMed] [Google Scholar]
- 32.Maga G, et al. DNA polymerase δ-interacting protein 2 is a processivity factor for DNA polymerase λ during 8-oxo-7,8-dihydroguanine bypass. Proc Natl Acad Sci USA. 2013;110(47):18850–18855. doi: 10.1073/pnas.1308760110. [DOI] [PMC free article] [PubMed] [Google Scholar]
- 33.Sánchez Alvarado A. Cellular hyperproliferation and cancer as evolutionary variables. Curr Biol. 2012;22(17):R772–R778. doi: 10.1016/j.cub.2012.08.008. [DOI] [PMC free article] [PubMed] [Google Scholar]
- 34. Chen H, Lin F XH (2014) The degenerative evolution from multicellularity to unicellularity during cancer. arXiv:1408.3236v1.
- 35.Goutelle S, et al. The Hill equation: A review of its capabilities in pharmacological modelling. Fundam Clin Pharmacol. 2008;22(6):633–648. doi: 10.1111/j.1472-8206.2008.00633.x. [DOI] [PubMed] [Google Scholar]
- 36.Ding L, et al. Clonal evolution in relapsed acute myeloid leukaemia revealed by whole-genome sequencing. Nature. 2012;481(7382):506–510. doi: 10.1038/nature10738. [DOI] [PMC free article] [PubMed] [Google Scholar]
- 37.Brody JP, Williams BA, Wold BJ, Quake SR. Significance and statistical errors in the analysis of DNA microarray data. Proc Natl Acad Sci USA. 2002;99(20):12975–12978. doi: 10.1073/pnas.162468199. [DOI] [PMC free article] [PubMed] [Google Scholar]
- 38.Trapnell C, Pachter L, Salzberg SL. TopHat: Discovering splice junctions with RNA-Seq. Bioinformatics. 2009;25(9):1105–1111. doi: 10.1093/bioinformatics/btp120. [DOI] [PMC free article] [PubMed] [Google Scholar]
- 39.DePristo MA, et al. A framework for variation discovery and genotyping using next-generation DNA sequencing data. Nat Genet. 2011;43(5):491–498. doi: 10.1038/ng.806. [DOI] [PMC free article] [PubMed] [Google Scholar]
- 40.Trapnell C, et al. Differential gene and transcript expression analysis of RNA-seq experiments with TopHat and Cufflinks. Nat Protoc. 2012;7(3):562–578. doi: 10.1038/nprot.2012.016. [DOI] [PMC free article] [PubMed] [Google Scholar]
- 41.Futreal PA, et al. A census of human cancer genes. Nat Rev Cancer. 2004;4(3):177–183. doi: 10.1038/nrc1299. [DOI] [PMC free article] [PubMed] [Google Scholar]
Associated Data
This section collects any data citations, data availability statements, or supplementary materials included in this article.


