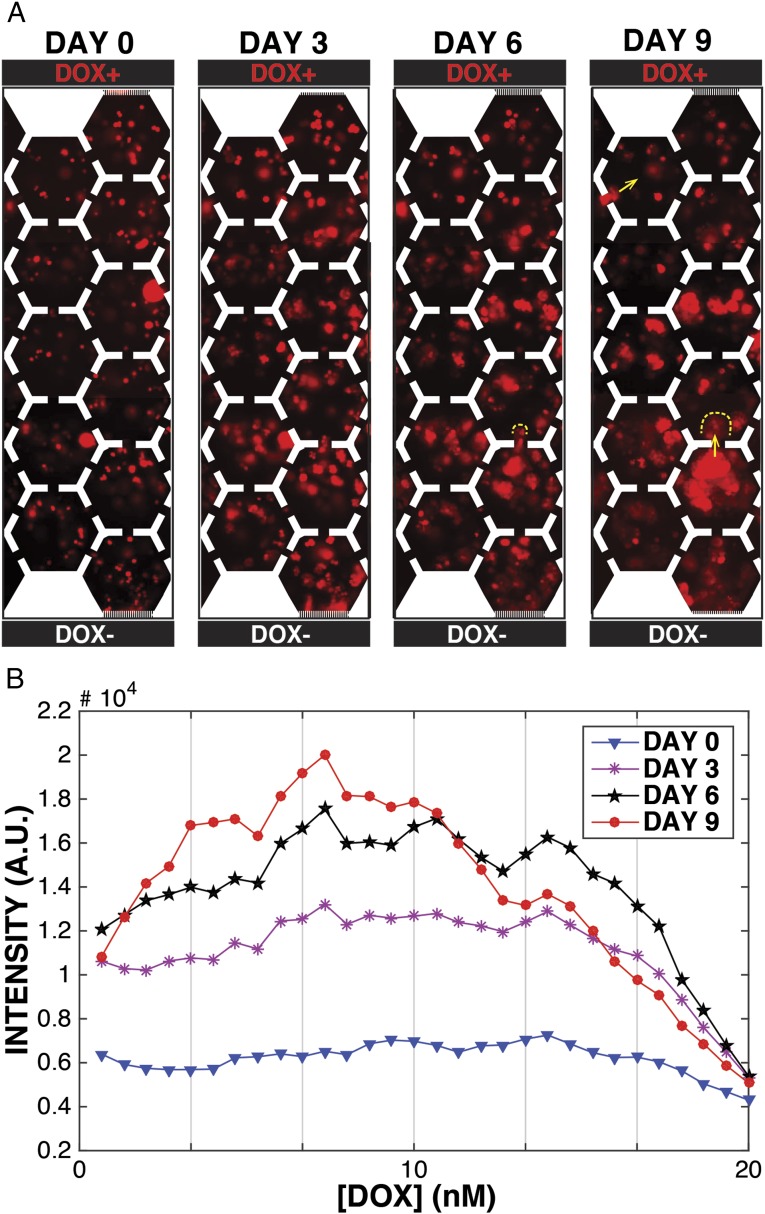
Fig. 2.
Emergence of doxorubicin resistance of MM cells in a doxorubicin gradient. (A) Images of MM cells (8226/RFP) under a doxorubicin gradient (0−20 nM per 2 mm) in time series. Doxorubicin diffuses from the top to the bottom. Yellow dotted lines denote possible routes for MM cell migration. (B) Averaged density of MM cells (red fluorescence intensity) as a function of time and position in the doxorubicin gradient.

