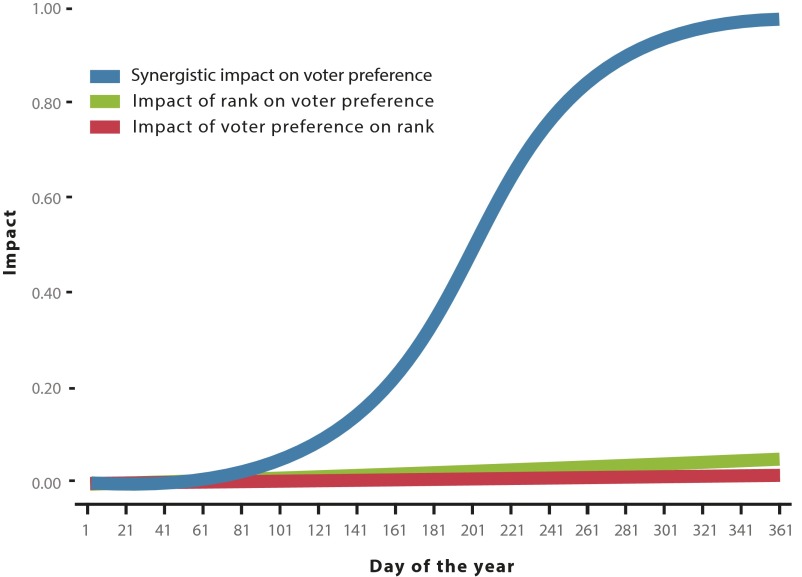
Fig. S1.
A possible synergistic relationship between the impact that search rankings have on voter preferences and the impact that voter preferences have on search rankings. The lower curves (red and green) show slow increases that might occur if each of the processes acted alone over the course of a year (365 iterations of the model). The upper curve (blue) shows the result of a possible synergy between these two processes using the same parameters that generated the two lower curves. The curves are generated by an iterative model using equations of the general form Vn+1 = Vn + r[Rn × (1 − Vn)] + r[On × (1 – Vn)], where V is voter preference for one candidate, R is the impact of voter preferences on search rankings, O is the impact (randomized with each iteration) of other influences on voter preferences, and r is a rate-of-change factor. Because a change in voter preference alters the proportion of votes available, its value in the model cannot exceed 1.0.

